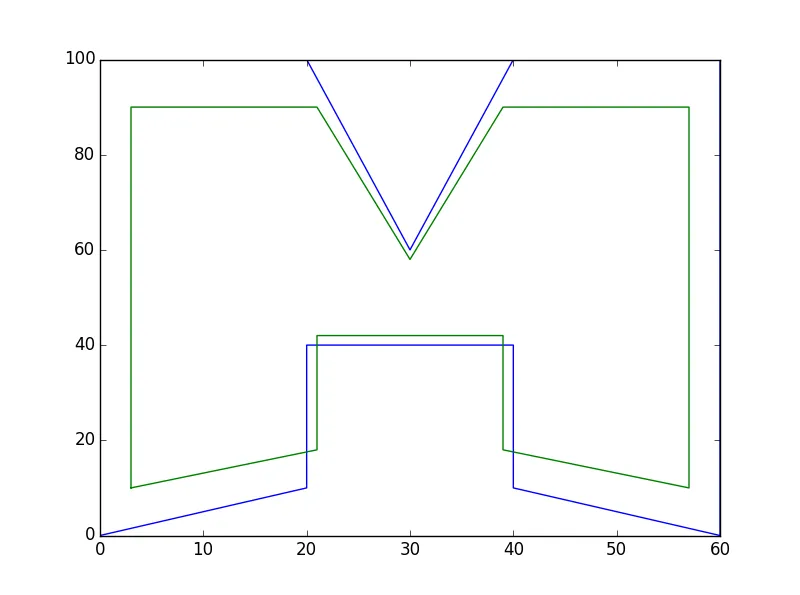
我认为在x轴和y轴上同时进行百分比缩小并且不使布局超出原始布局是数学上不可能的。但这只是我的猜测。
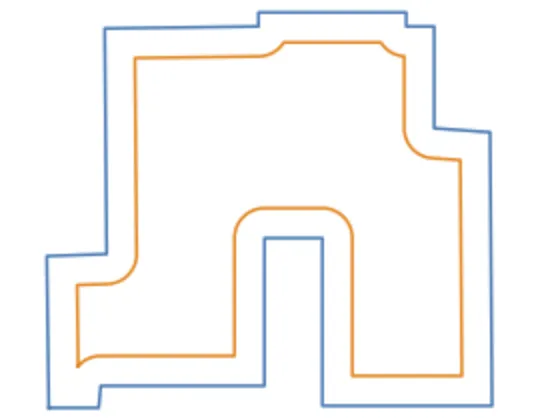
此代码将所有线条向中心移动一定距离,然后找到所有线条的新交点:
import matplotlib.pyplot as plt
def det(a, b):
return a[0] * b[1] - a[1] * b[0]
def line_intersection(line1, line2):
xdiff = (line1[0][0] - line1[1][0], line2[0][0] - line2[1][0])
ydiff = (line1[0][1] - line1[1][1], line2[0][1] - line2[1][1])
div = det(xdiff, ydiff)
if div == 0:
raise Exception('lines do not intersect')
d = (det(*line1), det(*line2))
x = det(d, xdiff) / div
y = det(d, ydiff) / div
return x, y
shrink_value_x = 3
shrink_value_y = 1.5
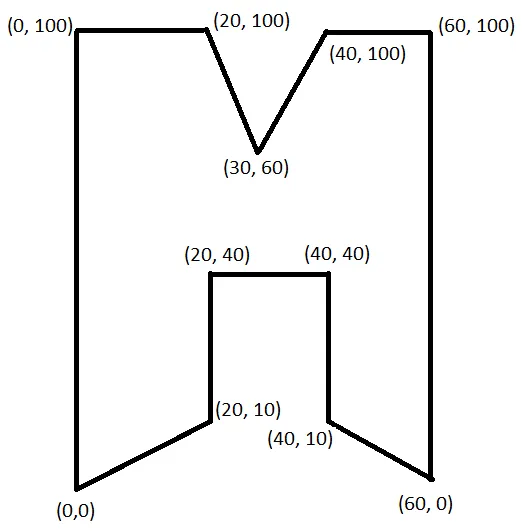
coords = [(0, 0), (0, 100), (20, 100), (30, 60), (40, 100), (60, 100), (60, 0), (40, 10), (40, 40), (20, 40), (20, 10)]
lines = [[coords[i-1], coords[i]] for i in range(len(coords))]
new_lines = []
for i in lines:
dx = i[1][0] - i[0][0]
dy = i[1][1] - i[0][1]
factor = 1 / (dx*dx + dy*dy)**0.5
new_dx = dy*shrink_value_x * factor
new_dy = dx*shrink_value_y * factor
new_lines.append([(i[0][0] + new_dx, i[0][1] - new_dy),
(i[1][0] + new_dx, i[1][1] - new_dy)])
new_coords = []
for i in range(len(new_lines)):
new_coords.append((line_intersection(new_lines[i-1], new_lines[i])))
我从Paul Draper那里得到了线段相交的代码。
这将输出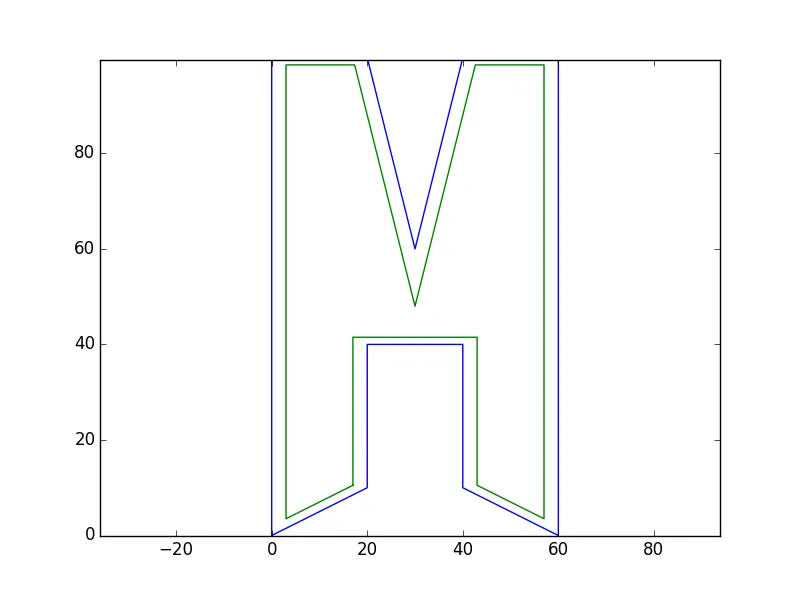 。
。