如何在R中按小时计算变量的平均值

6
我在尝试按小时计算平均温度时遇到了问题。
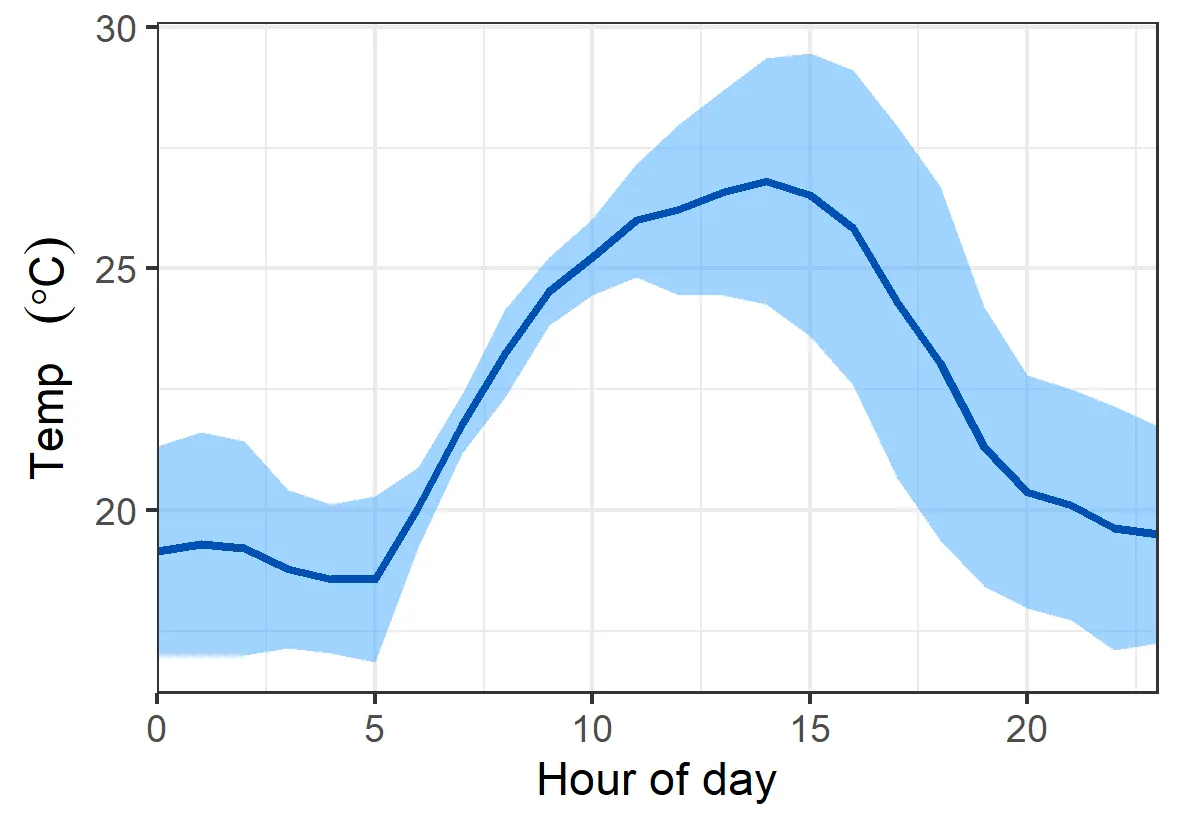
我有一个包括日期时间(hh:mm:ss p.m./a.m.)和温度的数据框。 我需要提取每小时的平均温度,以绘制温度的日变化图。
我是R的新手,但已经尝试了我的所学:首先将小时转换为数字,然后提取前两个字符,然后计算平均值,但效果不太好。而且我要分析的文件很多,最好有比我找到的“解决方案”更自动化和干净的方法。
我相信在R中有更好的计算每小时平均值的方法,因此我一直在其他帖子中寻找答案。不幸的是,我没有找到关于从时间数据中提取统计信息的明确答案。
我的数据看起来像这样:
          date     hour temperature
1   28/12/2013 13:03:01      41.572
2   28/12/2013 13:08:01      46.059
3   28/12/2013 13:13:01       48.55
4   28/12/2013 13:18:01      49.546
5   28/12/2013 13:23:01      49.546
6   28/12/2013 13:28:01      49.546
7   28/12/2013 13:33:01      50.044
8   28/12/2013 13:38:01      50.542
9   28/12/2013 13:43:01      50.542
10  28/12/2013 13:48:01       51.04
11  28/12/2013 13:53:01      51.538
12  28/12/2013 13:58:01      51.538
13  28/12/2013 14:03:01      50.542
14  28/12/2013 14:08:01       51.04
15  28/12/2013 14:13:01       51.04
16  28/12/2013 14:18:01      52.534
17  28/12/2013 14:23:01      53.031
18  28/12/2013 14:28:01      53.031
19  28/12/2013 14:33:01      53.031
20  28/12/2013 14:38:01      51.538
21  28/12/2013 14:43:01      53.031
22  28/12/2013 14:48:01      53.529
etc (24hs data)

我希望R能够计算每小时的平均值(不考虑分钟或秒钟的差异,仅按小时计算)

有什么建议吗? 非常感谢您提前的帮助!

祝好, 玛丽亚

3个回答

14

将日期和小时列合并为一个POSIXct列,并以每小时的间隔进行cut():

df <- read.table(header=TRUE, stringsAsFactors=FALSE, text="
date hour temperature
28/12/2013 13:03:01  41.572
28/12/2013 13:08:01  46.059
28/12/2013 13:13:01  48.55
28/12/2013 13:18:01  49.546
28/12/2013 13:23:01  49.546
28/12/2013 13:28:01  49.546
28/12/2013 13:33:01  50.044
28/12/2013 13:38:01  50.542
28/12/2013 13:43:01  50.542
28/12/2013 13:48:01  51.04
28/12/2013 13:53:01  51.538
28/12/2013 13:58:01  51.538
28/12/2013 14:03:01  50.542
28/12/2013 14:08:01  51.04
28/12/2013 14:13:01  51.04
28/12/2013 14:18:01  52.534
28/12/2013 14:23:01  53.031
28/12/2013 14:28:01  53.031
28/12/2013 14:33:01  53.031
28/12/2013 14:38:01  51.538
28/12/2013 14:43:01  53.031
28/12/2013 14:48:01  53.529
28/12/2013 15:01:01  50.77")

df$datehour <- cut(as.POSIXct(paste(df$date, df$hour),
   format="%d/%m/%Y %H:%M:%S"), breaks="hour") 
head(df)
        date     hour temperature            datehour
1 28/12/2013 13:03:01      41.572 2013-12-28 13:00:00
2 28/12/2013 13:08:01      46.059 2013-12-28 13:00:00
3 28/12/2013 13:13:01      48.550 2013-12-28 13:00:00
4 28/12/2013 13:18:01      49.546 2013-12-28 13:00:00
5 28/12/2013 13:23:01      49.546 2013-12-28 13:00:00
6 28/12/2013 13:28:01      49.546 2013-12-28 13:00:00

现在按小时聚合:

means <- aggregate(temperature ~ datehour, df, mean)
head(means)
             datehour temperature
1 2013-12-28 13:00:00    49.17192
2 2013-12-28 14:00:00    52.23470
3 2013-12-28 15:00:00    50.77000

plot(as.POSIXct(means$datehour), means$temperature, type="l", las=1,
     main="Hourly Avg Temperatures", xlab="Hour", ylab="")

但是,对于时间序列数据,我喜欢使用xts软件包:

require(xts)
df.xts <- xts(df$temperature, as.POSIXct(paste(df$date, df$hour),
      format="%d/%m/%Y %H:%M:%S"))
head(df.xts)
                      [,1]
2013-12-28 13:03:01 41.572
2013-12-28 13:08:01 46.059
2013-12-28 13:13:01 48.550
2013-12-28 13:18:01 49.546
2013-12-28 13:23:01 49.546
2013-12-28 13:28:01 49.546

means <- period.apply(df.xts, endpoints(df.xts, "hours"), mean)
head(means)
                        [,1]
2013-12-28 13:58:01 49.17192
2013-12-28 14:48:01 52.23470
2013-12-28 15:01:01 50.77000

注意时间戳是每小时的最后一条记录。我们可以使用这个函数将时间戳(向下)对齐到整点:

align.time.down = function(x,n){ index(x) = index(x)-n; align.time(x,n) }
means.rounded <- align.time.down(means, 60*60)  
         # 2nd argument is the number of seconds to adjust/round to,
         # just like function align.time()

head(means.rounded)
                        [,1]
2013-12-28 13:00:00 49.17192
2013-12-28 14:00:00 52.23470
2013-12-28 15:00:00 50.77000

plot(means.rounded, las=1, main="Hourly Avg Temperatures")

enter image description here


当我按小时列进行聚合时,出现了错误消息(Error in get(as.character(FUN), mode = "function", envir = envir) : object 'FUN' of mode 'function' was not found)。我该如何解决? - milawithict

3

如果题目中提供了示例数据和期望输出,那么解题就会更容易。

使用Data.table包的解决方案

require(data.table)
data <- fread('temp.csv',sep=',') #Assuming your data is in temp.csv
#if above step not executed, convert the data frame to data.table 
data <- data.table(data)
> str(data)
Classes ‘data.table’ and 'data.frame':  12 obs. of  3 variables:
$ date       : chr  "28/12/2013" "28/12/2013" "28/12/2013" "28/12/2013" ...
$ hour       : chr  "13:03:01" "13:08:01" "13:13:01" "13:18:01" ...
$ temperature: num  41.6 46.1 48.5 49.5 49.5 ...

> data
      date     hour    temperature      avg
1: 27/12/2013 13:00:00       42.99 35.78455
2: 27/12/2013 14:00:00       65.97 35.78455
3: 27/12/2013 15:00:00       63.57 35.78455 

  data[,list(avg=mean(temperature)),by=hour] #dataset is sorted by hour
    hour   avg
1: 13:00:00 42.99
2: 14:00:00 65.97
3: 15:00:00 63.57
  data[,list(avg=mean(temperature)),by="date,hour"] #data set is grouped by date,then hour
        date     hour   avg
1: 27/12/2013 13:00:00 42.99
2: 27/12/2013 14:00:00 65.97
3: 27/12/2013 15:00:00 63.57

data[,list(avg=mean(temperature)),by=list(date,hour(as.POSIXct(data$hour, format = "%H:%M:%S")))] # to group by hour only 
     date     hour    avg
1: 27/12/2013    1 29.530
2: 27/12/2013    4 65.970

1
确切地说,我尝试了你的脚本,但是出现了以下错误信息:Error in [.data.frame(data, , list(avg = mean(temperature)), by = hour) : unused argument (by = hour)我正在深入研究为什么会出现这个错误消息。 - Maria
1
你之所以会收到那个错误信息,是因为这是一个数据框。我猜你在读取数据时没有使用fread命令,如果是这样的话,应该用data <- data.table(data)命令将其转换成数据表。 - on_the_shores_of_linux_sea
如果您只按小时分组,例如13:xx:xx,它将返回所有日期的13:00的平均值。从上述示例数据中,我得到了13点的平均值为49.17192。 - on_the_shores_of_linux_sea
执行str(data)命令,它将显示每个字段的类型。检查温度是否为数字。 - on_the_shores_of_linux_sea
类'data.table'和'data.frame': 3个变量的12个观测值: $ date : chr "28/12/2013" "28/12/2013" "28/12/2013" "28/12/2013" ... $ hour : chr "13:03:01" "13:08:01" "13:13:01" "13:18:01" ... $ temperature: num 41.6 46.1 48.5 49.5 49.5 ... - on_the_shores_of_linux_sea
显示剩余11条评论

0

尝试这个例子:

library(foqat)
met2=avri(met[,c(1,2)], bkip="1 hour", mode="ncycle", value=24)

#plot it
geom_avri(
    met2,
    cave=2, csd=3,
    alpha=0.5, lcc="#0050b3", rff="#40a9ff", 
    xlab="Hour of day", ylab=bquote(Temp~" "~(degree*C))
)

enter image description here


网页内容由stack overflow 提供, 点击上面的
可以查看英文原文,
原文链接