如何在分面 R ggplot 箱线图中删除未使用的因子?

4
以下是我用来制作一些箱线图的示例代码:
stest <- read.table(text="    site  year    conc
    south   2001    5.3
    south   2001    4.67
    south   2001    4.98
    south   2002    5.76
    south   2002    5.93
    north   2001    4.64
    north   2001    6.32
    north   2003    11.5
    north   2003    6.3
    north   2004    9.6
    north   2004    56.11
    north   2004    63.55
    north   2004    61.35
    north   2005    67.11
    north   2006    39.17
    north   2006    43.51
    north   2006    76.21
    north   2006    158.89
    north   2006    122.27
", header=TRUE)

require(ggplot2)
ggplot(stest, aes(x=year, y=conc)) +
  geom_boxplot(horizontal=TRUE) +
  facet_wrap(~site, ncol=1) +
  coord_flip() +
  scale_y_log10()

这导致了以下结果: boxplot 
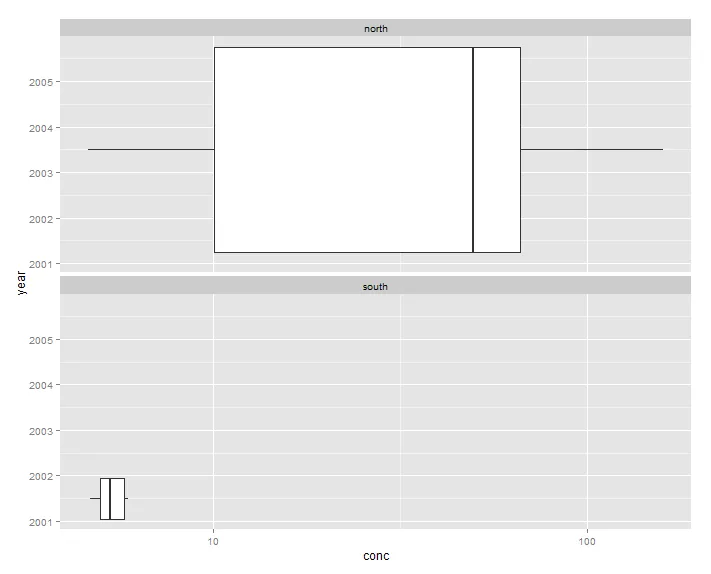
我已经尽我所能尝试各种方法,但无法制作一个只包含显示数据的年份(2001和2002)的南侧图。我想做的事情可能吗?
这是一个展示我想要实现的截图的链接 (失效):
2个回答

4
使用scales='free.x'参数来调用facet_wrap函数。但我怀疑你需要做更多的工作才能得到你想要的图形。
具体来说,在你最初的ggplot调用中使用aes(x=factor(year), y=conc)

谢谢,Justin。我尝试过了,但是"ggplot2目前不支持非笛卡尔坐标或coord_flip的自由比例尺"。我还尝试了在facet_grid中使用scale="free_x",但似乎没有任何效果。 - George Gorczynski
2
从0.9.3版本开始,使用coord_flip()与免费比例是不被允许的。请参见https://github.com/hadley/ggplot2/issues/673。 - orizon

0
一个简单的方法来解决你的问题(并且效果还不错):
分别生成两个箱线图,然后使用gridExtra包中的grid.arrange命令将它们合并在一起。
library(gridExtra)

p1 <- ggplot(subset(stest,site=="north"), aes(x=factor(year), y=conc)) +
 geom_boxplot(horizontal=TRUE) + coord_flip() + scale_y_log10(name="")

p2 <- ggplot(subset(stest,site=="south"), aes(x=factor(year), y=conc)) +
 geom_boxplot(horizontal=TRUE) + coord_flip() + 
 scale_y_log10(name="X Title",breaks=seq(4,6,by=.5)) +

grid.arrange(p1, p2, ncol=1)

Marco,谢谢。我也探索了创建单独图形并将它们连接的选项。但是这种解决方案的问题在于,图形的高度相同,使得列出较少年份的情节的框更高。有什么想法可以修复此问题,使两个情节具有相同的外观框?(屏幕截图在此处:http://dl.dropbox.com/u/20145982/2013-01-24_0949.png) - George Gorczynski

网页内容由stack overflow 提供, 点击上面的
可以查看英文原文,
原文链接