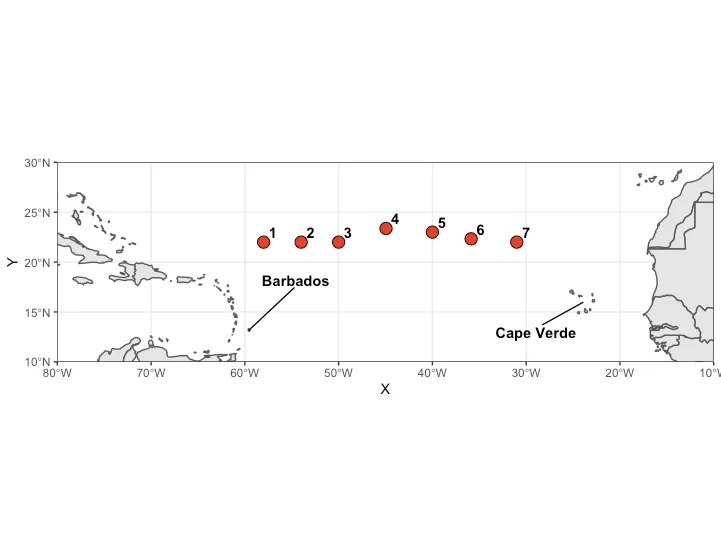
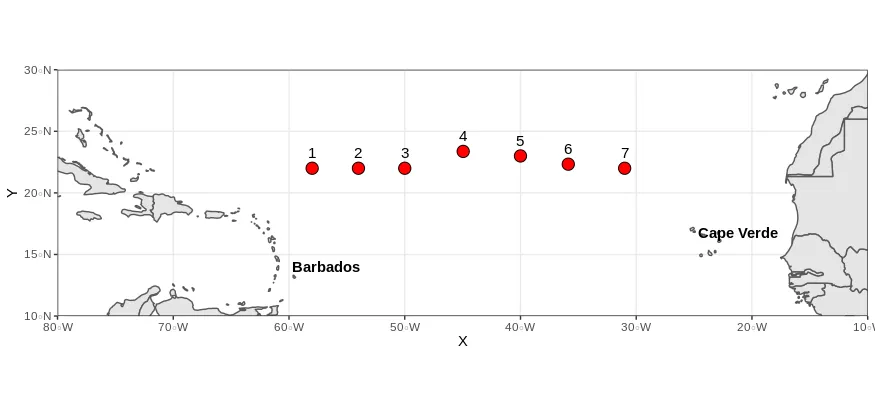
我创建了一个地图,标出了我的数据点。我希望:
- 城市名称更加清晰可见,可以上下移动。
- 给数据点标上1-7的标签,让数字显示在顶部。
这是我的数据集和我的操作:
library("ggplot2")
theme_set(theme_bw())
library("sf")
library("rnaturalearth")
library("rnaturalearthdata")

stations <- data.frame(longitude = c(-58,-54,-50,-44.95,-40,-35.87,-31), latitude = c(22,22,22,23.367,23,22.33,22))

world <- ne_countries(scale = "medium", returnclass = "sf")
class(world)

world_points<- st_centroid(world)
world_points <- cbind(world, st_coordinates(st_centroid(world$geometry)))

a <- world_points[50,]
b <- world_points[34,]
cities <- rbind(a,b)

ggplot(data = world) +
    geom_sf() +
  geom_text(data= cities,aes(x=X, y=Y, label=name),
    color = "black", fontface = "bold", check_overlap = FALSE) +
annotate(geom = "text", x = -90, y = 26, label = "Gulf of Mexico",
    fontface = "italic", color = "grey22", size = 6) +
    geom_point(data = stations, aes(x = longitude, y = latitude), size = 4,
        shape = 21, fill = "red") +
    coord_sf(xlim = c(-80, -10), ylim = c(10, 30), expand = FALSE)