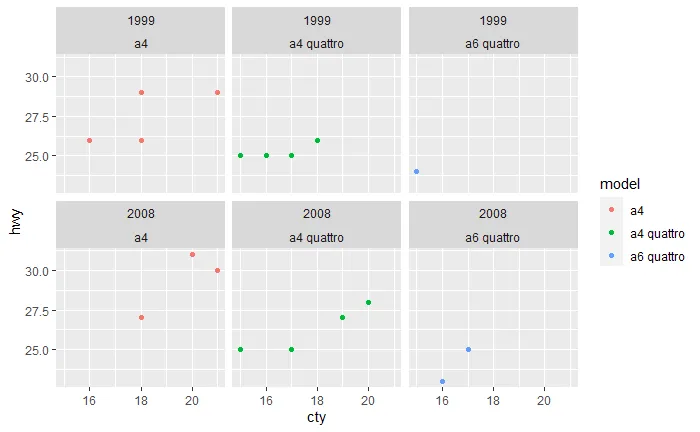
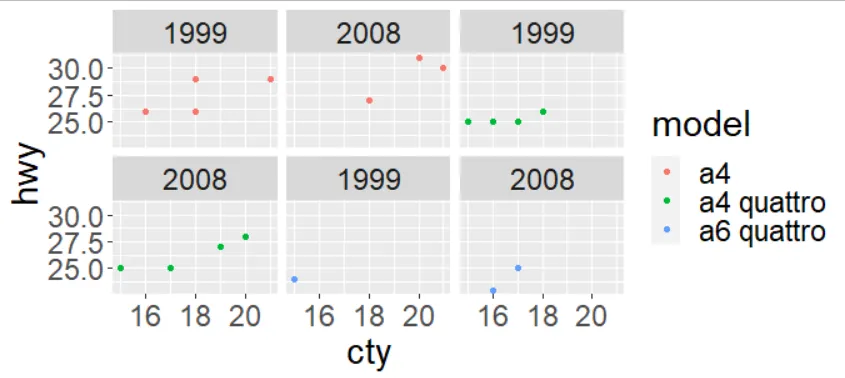
如何控制要显示的facet_wrap标签。
5
- Ryan
1
相关链接:https://dev59.com/A1QJ5IYBdhLWcg3wSj0C 和 https://dev59.com/16Pia4cB1Zd3GeqPynOB - MrFlick
2个回答
6
最简单的方式是调整标签函数,只提取第一个变量的标签。你可以通过以下方式实现:
mpg %>%
  filter(manufacturer=='audi')%>%
  ggplot(aes(cty, hwy)) +
  geom_point(aes(col = model)) +
  facet_wrap(~year+model, labeller=function(x) {x[1]})
另一种方法是创建一个交互变量,这样您只需要在一个变量上进行分面,并且可以更改标签器以去除第二个值的名称。示例代码如下:
mpg %>%
  filter(manufacturer=='audi')%>%
  ggplot(aes(cty, hwy)) +
  geom_point(aes(col = model)) +
  facet_wrap(~interaction(year,model), labeller=as_labeller(function(x) gsub("\\..*$", "", x)))
- MrFlick
1
另一种选择是定义自定义标签器函数。我在“标签器”文档中发现关于输入和输出格式的解释有些令人困惑。因此,希望这个简单的示例可以帮助其他人。
library(tidyverse)
mpg %>%
  filter(manufacturer=='audi')%>%
  ggplot(aes(cty, hwy)) +
  geom_point(aes(col = model)) +
  facet_wrap(year~model,
             labeller = function(df) {
               list(as.character(df[,1]))
             })
- see24
网页内容由stack overflow 提供, 点击上面的可以查看英文原文,
原文链接
原文链接

