如何从由 st_coordinates 创建的坐标矩阵中重构 sf 对象?

3

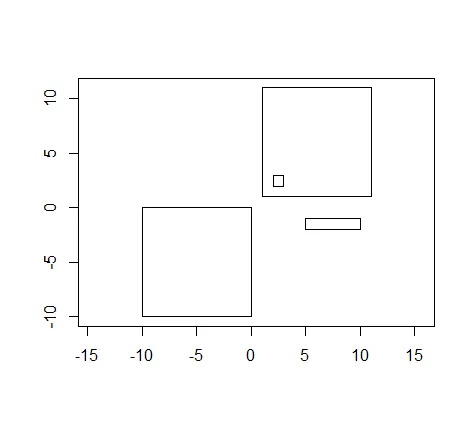
st_coordinates 提供了一个简单要素列中所有环的坐标矩阵(用于每个简单要素几何体,所有多边形的外环和洞)。是否有一种方法可以反向操作,即从与 st_coordinates 输出相同格式的矩阵构建 sfc?

作为提醒,这是 st_coordinates 输出的结构:

        X   Y L1 L2 L3
 [1,]   0   0  1  1  1
 [2,] -10   0  1  1  1
 [3,] -10 -10  1  1  1
 [4,]   0 -10  1  1  1
 [5,]   0   0  1  1  1
 [6,]   1   1  1  1  2
 [7,]  11   1  1  1  2
 [8,]  11  11  1  1  2
 [9,]   1  11  1  1  2
[10,]   1   1  1  1  2
[11,]   2   2  2  1  2
[12,]   3   2  2  1  2
[13,]   3   3  2  1  2
[14,]   2   3  2  1  2
[15,]   2   2  2  1  2
[16,]   5  -2  1  2  2
[17,]  10  -2  1  2  2
[18,]  10  -1  1  2  2
[19,]   5  -1  1  2  2
[20,]   5  -2  1  2  2

对应于这张图片:

enter image description here

如何创建sf对象?
2个回答

2
通过使用 data.frame,可以执行以下操作:
library(sf)
library(tidyverse)
d <- 
  structure(list(X = c(0L, -10L, -10L, 0L, 0L, 1L, 11L, 11L, 1L, 
                       1L, 2L, 3L, 3L, 2L, 2L, 5L, 10L, 10L, 5L, 5L), 
                 Y = c(0L, 0L, -10L, -10L, 0L, 1L, 1L, 11L, 11L, 1L, 2L, 2L, 3L, 
                       3L, 2L, -2L, -2L, -1L, -1L, -2L),
                 L1 = c(1L, 1L, 1L, 1L, 1L, 1L, 1L, 1L, 1L, 1L, 2L, 2L, 2L, 2L,
                        2L, 1L, 1L, 1L, 1L, 1L), 
                 L2 = c(1L, 1L, 1L, 1L, 1L, 1L, 1L, 1L, 1L, 1L, 1L, 1L, 1L, 1L,
                        1L, 2L, 2L, 2L, 2L, 2L), 
                 L3 = c(1L, 1L, 1L, 1L, 1L, 2L, 2L, 2L, 2L, 2L, 2L, 2L, 2L, 2L, 
                        2L, 2L, 2L, 2L, 2L, 2L)), 
            class = "data.frame", row.names = c(NA, -20L))   %>% 
  st_as_sf(coords = c("X", "Y")) %>% 
  group_by(L1, L2, L3) %>% 
  summarise(do_union = FALSE) %>% 
  st_cast("LINESTRING")
# to visualise
d %>% 
  ggplot() +
  geom_sf()
# to generate polygons
d %>% 
  st_cast("POLYGON") %>% 
  ggplot() +
  geom_sf()

补充说明

针对Jean-Luc Dupouey所发表的关于hole的正确评论,我想这个代码应该解决了这个问题:

d.po <-
  d %>% 
  group_by(L2, L3) %>% 
  summarise(do_union = FALSE) %>% 
  st_cast("MULTILINESTRING") %>% 
  st_cast("MULTIPOLYGON") %>% 
  ungroup()
# visualise
d.po %>% 
  unite("group", L2:L3) %>% 
  ggplot() +
  geom_sf(aes(fill = group))

感谢@einar的提议。然而,它没有产生正确的结果。洞口(根据sf规格,列L1)未被呈现。 - undefined

0

可以的,一个可能的方法是使用sf::st_polygon()函数调用。

该函数期望以列表格式提供参数 - 第一项是外边界,然后根据需要添加孔洞。

作为示例,考虑以下代码,它基于众所周知且备受喜爱的NC shapefile。

它的功能是将Mecklenburg县分解为边界的坐标矩阵,然后构建成一个sfg >> sfc >> sf对象。

library(sf)
library(dplyr)
library(ggplot2)

shape <- st_read(system.file("shape/nc.shp", package="sf")) %>%  
  filter(CNTY_ID == 2041) # Mecklenburg, as in Charlotte of Mecklenburg-Strelitz

#coordinates of Mecklenburg cnty
coords <- st_coordinates(shape)

class(coords)
[1] "matrix" "array" 

head(coords)
             X        Y L1 L2 L3
[1,] -81.04930 35.15153  1  1  1
[2,] -81.02396 35.14903  1  1  1
[3,] -81.00728 35.16325  1  1  1
[4,] -81.00152 35.19599  1  1  1
[5,] -81.01405 35.24990  1  1  1
[6,] -80.97964 35.33327  1  1  1

#a polygon from coords
meck_cnty <- st_polygon(x = list(coords[, 1:2])) %>%  # just X and Y please
  st_sfc() %>%  # from sfg to sfc
  st_sf() # from sfc to sf

class(meck_cnty)
[1] "sf"         "data.frame"

plot(meck_cnty)

mecklenburg county outline


谢谢。但是你的代码只适用于一个多边形。我的问题是关于一般的sf对象,比如在初始问题中给出的矩阵(包括多边形、洞等)。 - undefined
原则上,可以通过嵌套的for循环或lapply调用来构建st_multipolygon()函数所需的列表。这可以基于st_coordinates函数返回的L1、L2和L3值的组合来实现。唯一需要假设的是你正在重建一个多边形(multipolygon)还是多线段(multiline)。不幸的是,我手头没有准备好的代码可以完成这个任务。 - undefined

网页内容由stack overflow 提供, 点击上面的
可以查看英文原文,
原文链接