Matplotlib 2字体不一致问题

6

我将Anaconda Python更新到最新版本(4.3),其中Matplotlib升级到了2版。

此次升级对默认样式进行了一些重大更改(请参见此处)。 虽然我喜欢其中的一些更改,但我并不完全同意其中的一些更改。

因此,我根据上述链接建议进行了一些修改:

#%matplotlib inline
#%config InlineBackend.figure_format = 'svg'
import scipy as sc
import matplotlib.pyplot as plt
import matplotlib

# http://matplotlib.org/users/dflt_style_changes.html
params = {'legend.fontsize': 18,
          'axes.labelsize': 18,
          'axes.titlesize': 18,
          'xtick.labelsize' :12,
          'ytick.labelsize': 12,
          'mathtext.fontset': 'cm',
          'mathtext.rm': 'serif',
          'grid.color': 'k',
          'grid.linestyle': ':',
          'grid.linewidth': 0.5,
         }
matplotlib.rcParams.update(params)

x = sc.linspace(0,100)
y = x**2
fig = plt.figure('Fig')
ax = fig.add_subplot(1, 1, 1)
lines = ax.semilogy(x, y)
ax.set_yticks([300], minor=True)
ax.yaxis.grid(True, which='minor')
ax.yaxis.set_minor_formatter(matplotlib.ticker.ScalarFormatter())
ax.tick_params(axis='y', pad=10)
ax.set_xlabel(r'$\mathrm{R_L}$')
ax.set_ylabel(r'$\sigma \int_l \; dx$')
#fig.savefig('./PNG/test.png', dpi=300, bbox_inches='tight')

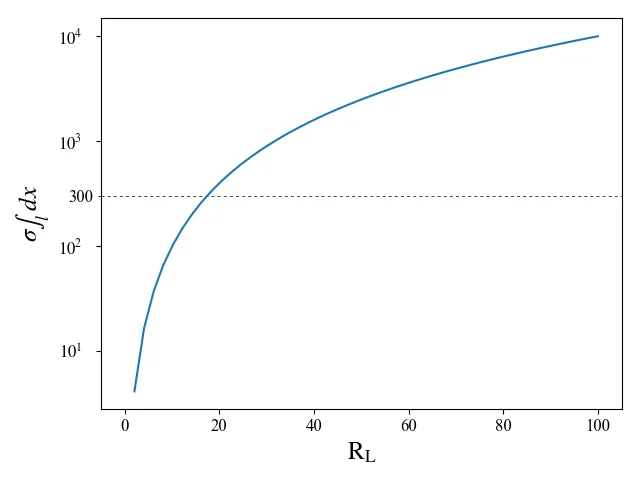
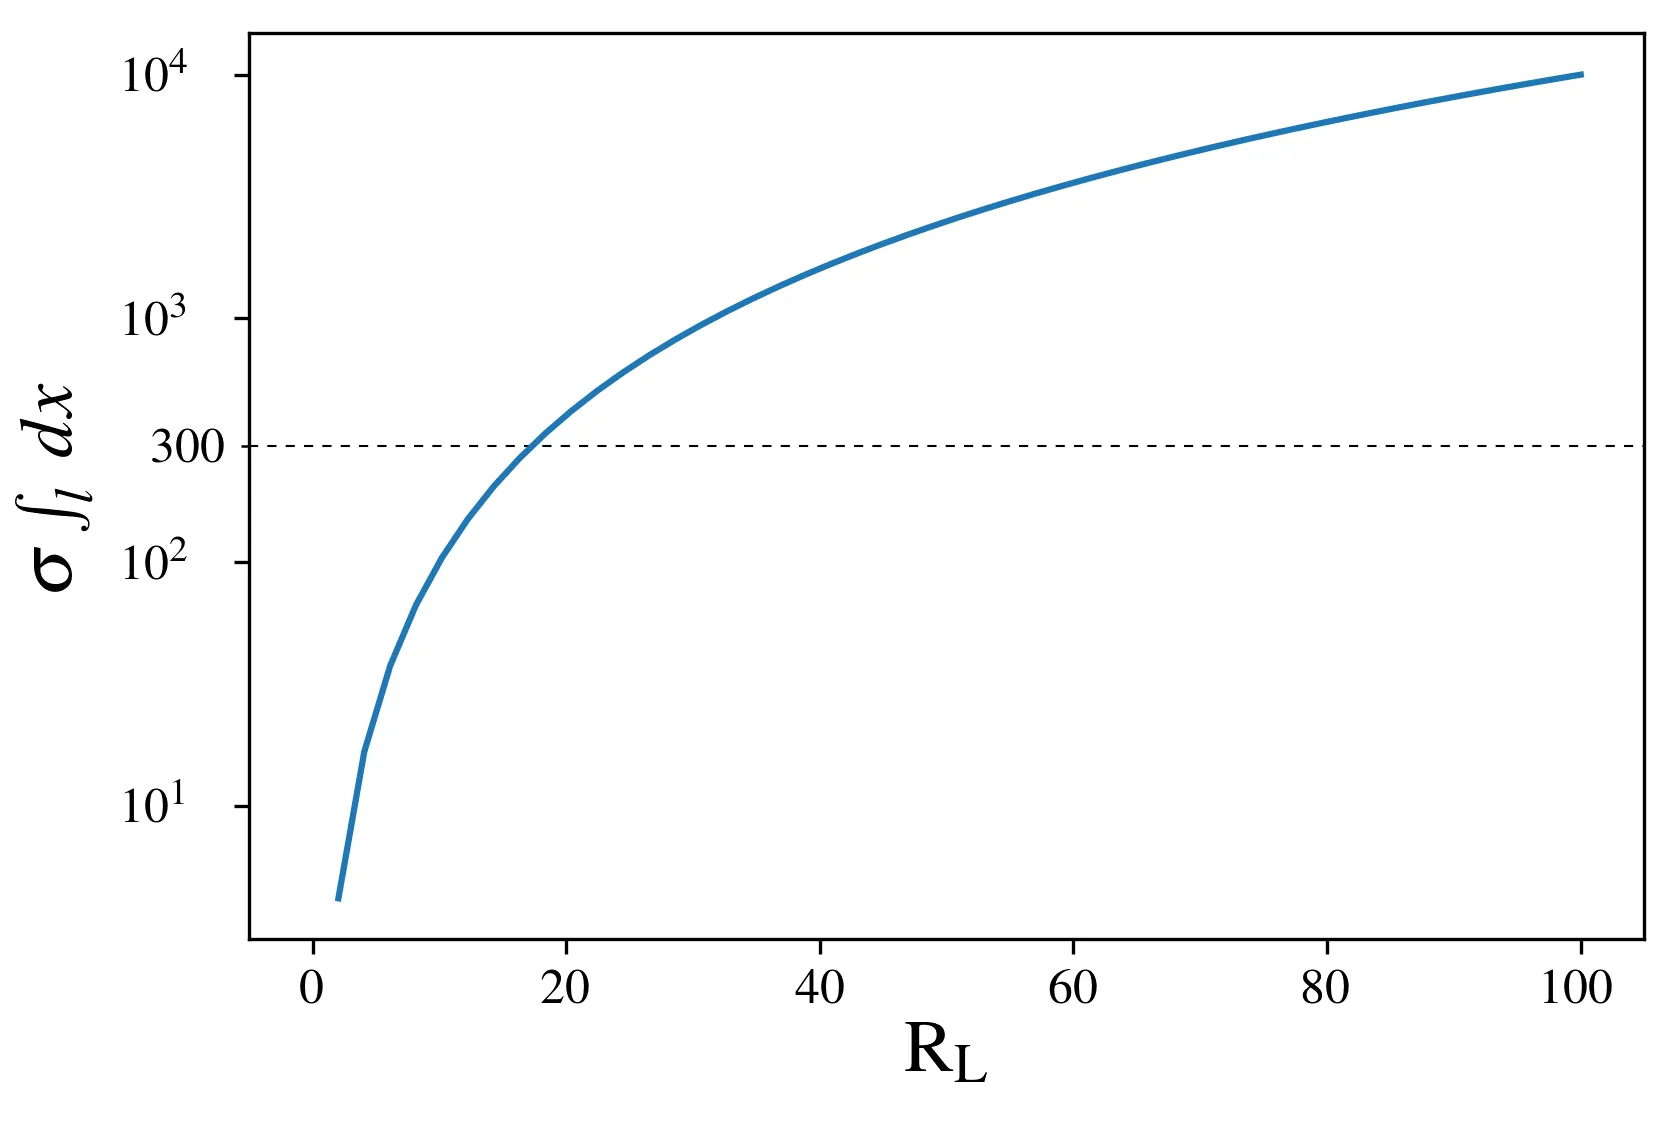
在上面的代码中使用Latex作为坐标轴标签会导致图表上的文本不一致(请参见下面的图像)。

enter image description here

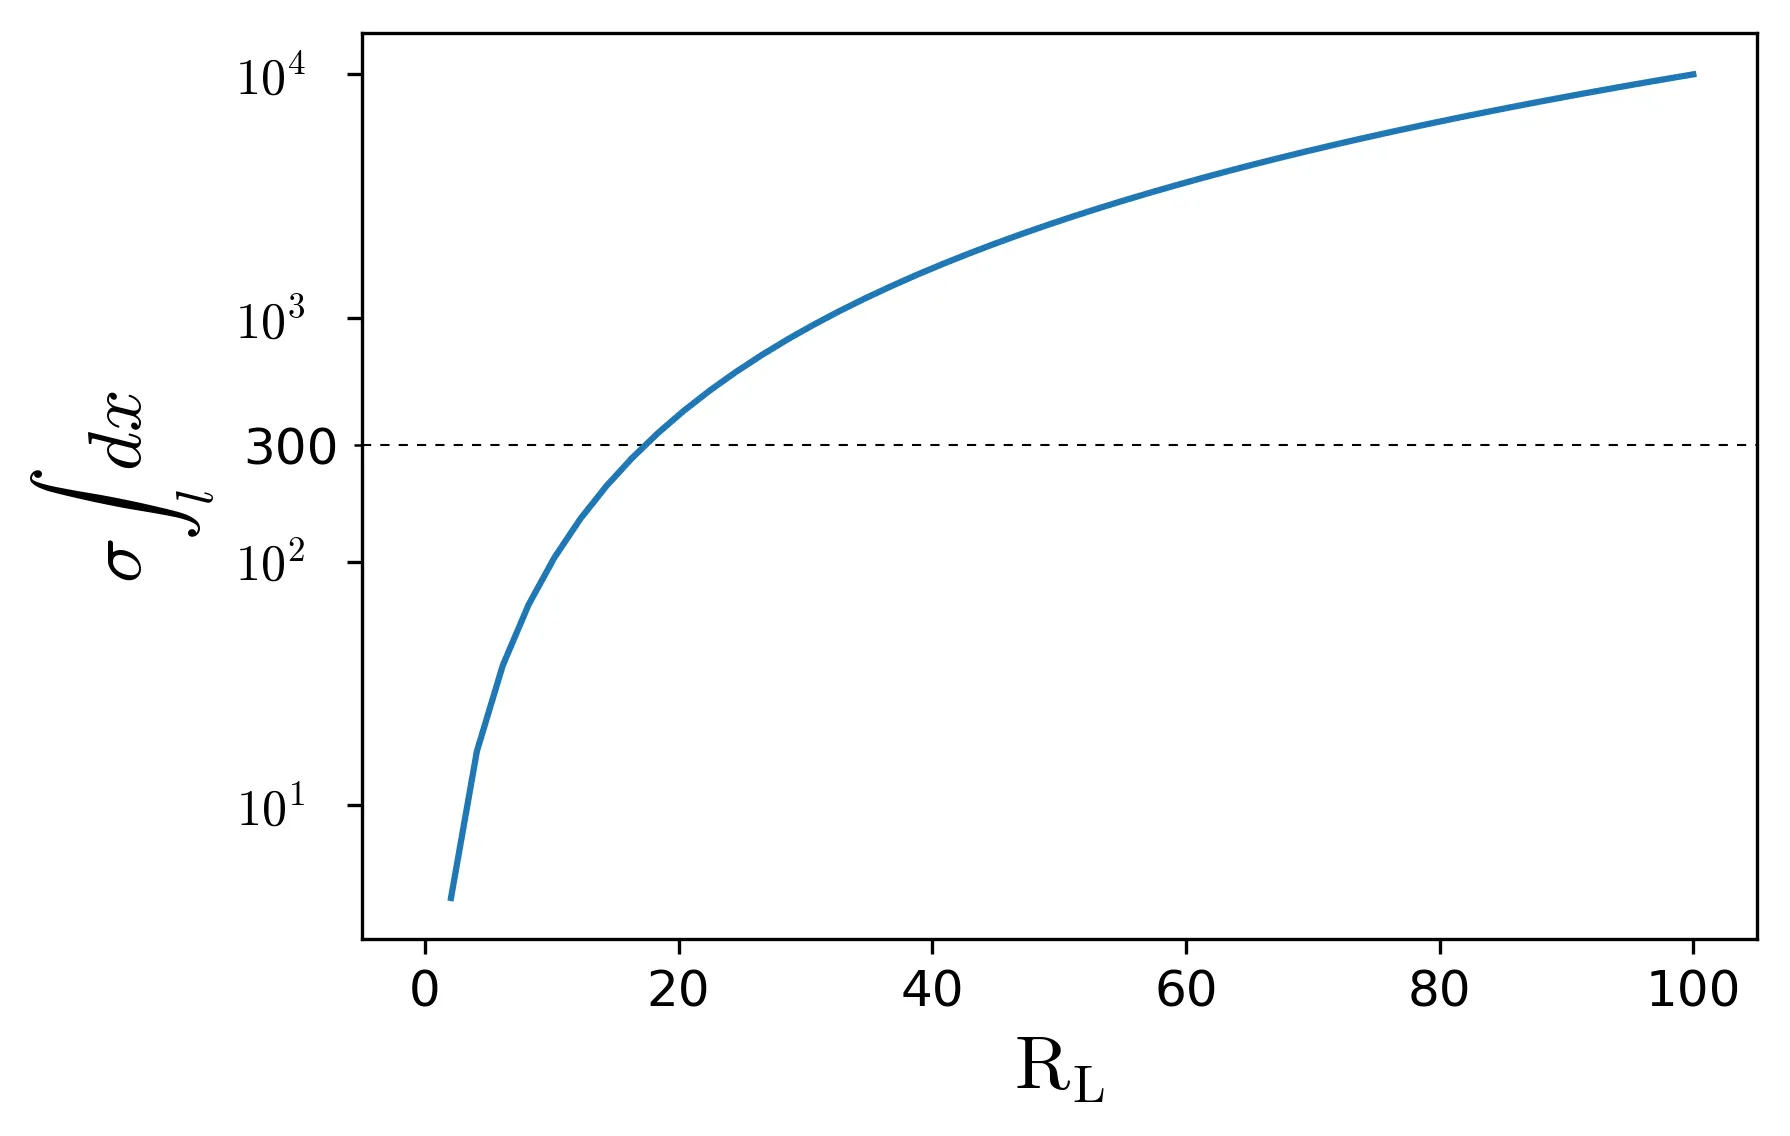
如何返回到以前的行为(请参见下面的图像)或者获得一致的字体方案?

enter image description here

编辑: 使用Latex后端可以得到一个好的结果,但速度非常慢。 无论如何,我认为内部后端应该能够得到一致的输出,并且切换到不同的后端并不是真正的解决方案,而更多的是一种解决方法。

要使用latex后端:

#%matplotlib inline
#%matplotlib notebook
#%config InlineBackend.figure_format = 'svg'
import scipy as sc
import matplotlib.pyplot as plt
import matplotlib

# http://matplotlib.org/users/dflt_style_changes.html
params = {'legend.fontsize': 18,
          'axes.labelsize': 18,
          'axes.titlesize': 18,
          'xtick.labelsize' :12,
          'ytick.labelsize': 12,
          'mathtext.fontset': 'cm',
          'mathtext.rm': 'serif',
          'grid.color': 'k',
          'grid.linestyle': ':',
          'grid.linewidth': 0.5,
         }
matplotlib.rcParams.update(params)
matplotlib.rcParams.update({'text.usetex':True, 'text.latex.preamble':[r'\usepackage{amsmath, newtxmath}']})

x = sc.linspace(0,100)
y = x**2
fig = plt.figure('Fig')
ax = fig.add_subplot(1, 1, 1)
lines = ax.semilogy(x, y)
ax.set_yticks([300], minor=True)
ax.yaxis.grid(True, which='minor')
ax.yaxis.set_minor_formatter(matplotlib.ticker.ScalarFormatter())
ax.tick_params(axis='y', pad=10)
ax.set_xlabel(r'$\mathrm{R_L}$')
ax.set_ylabel(r'$\sigma \int_l \; dx$')
#fig.savefig('./PNG/test.png', dpi=300, bbox_inches='tight')

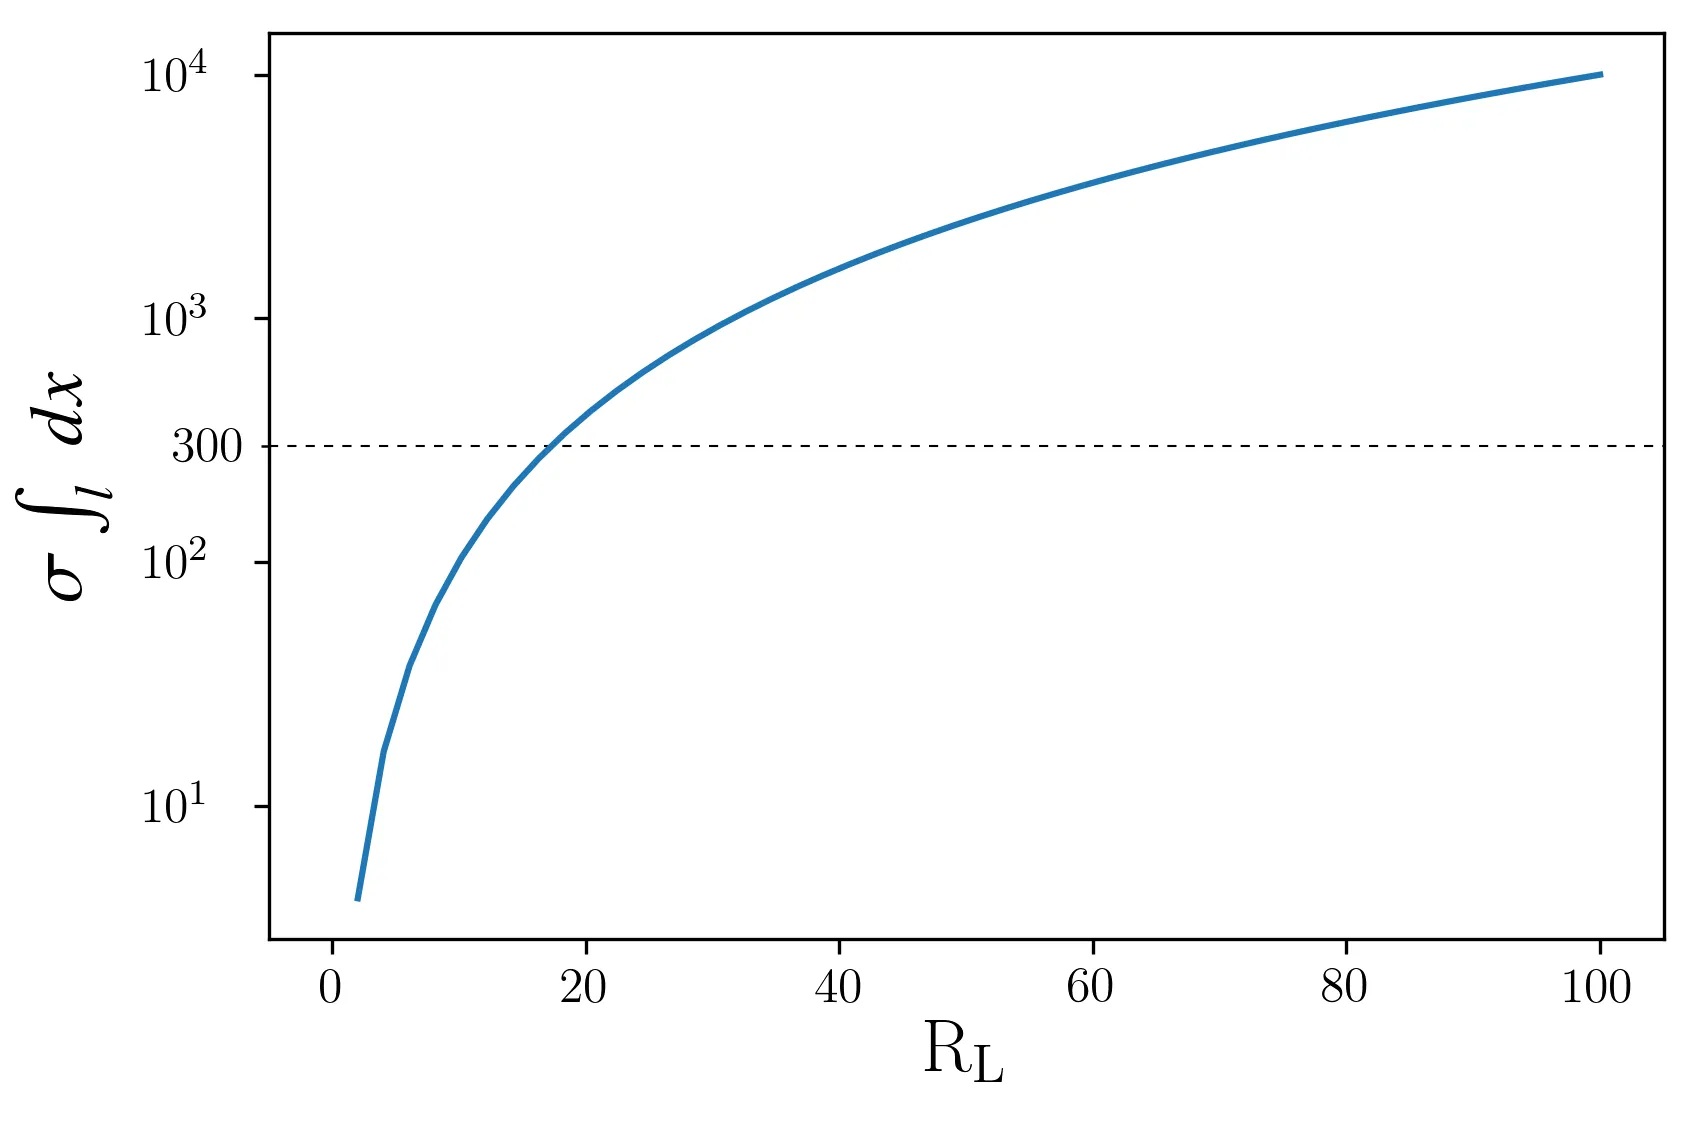
使用matplotlib 2的结果如下:

enter image description here

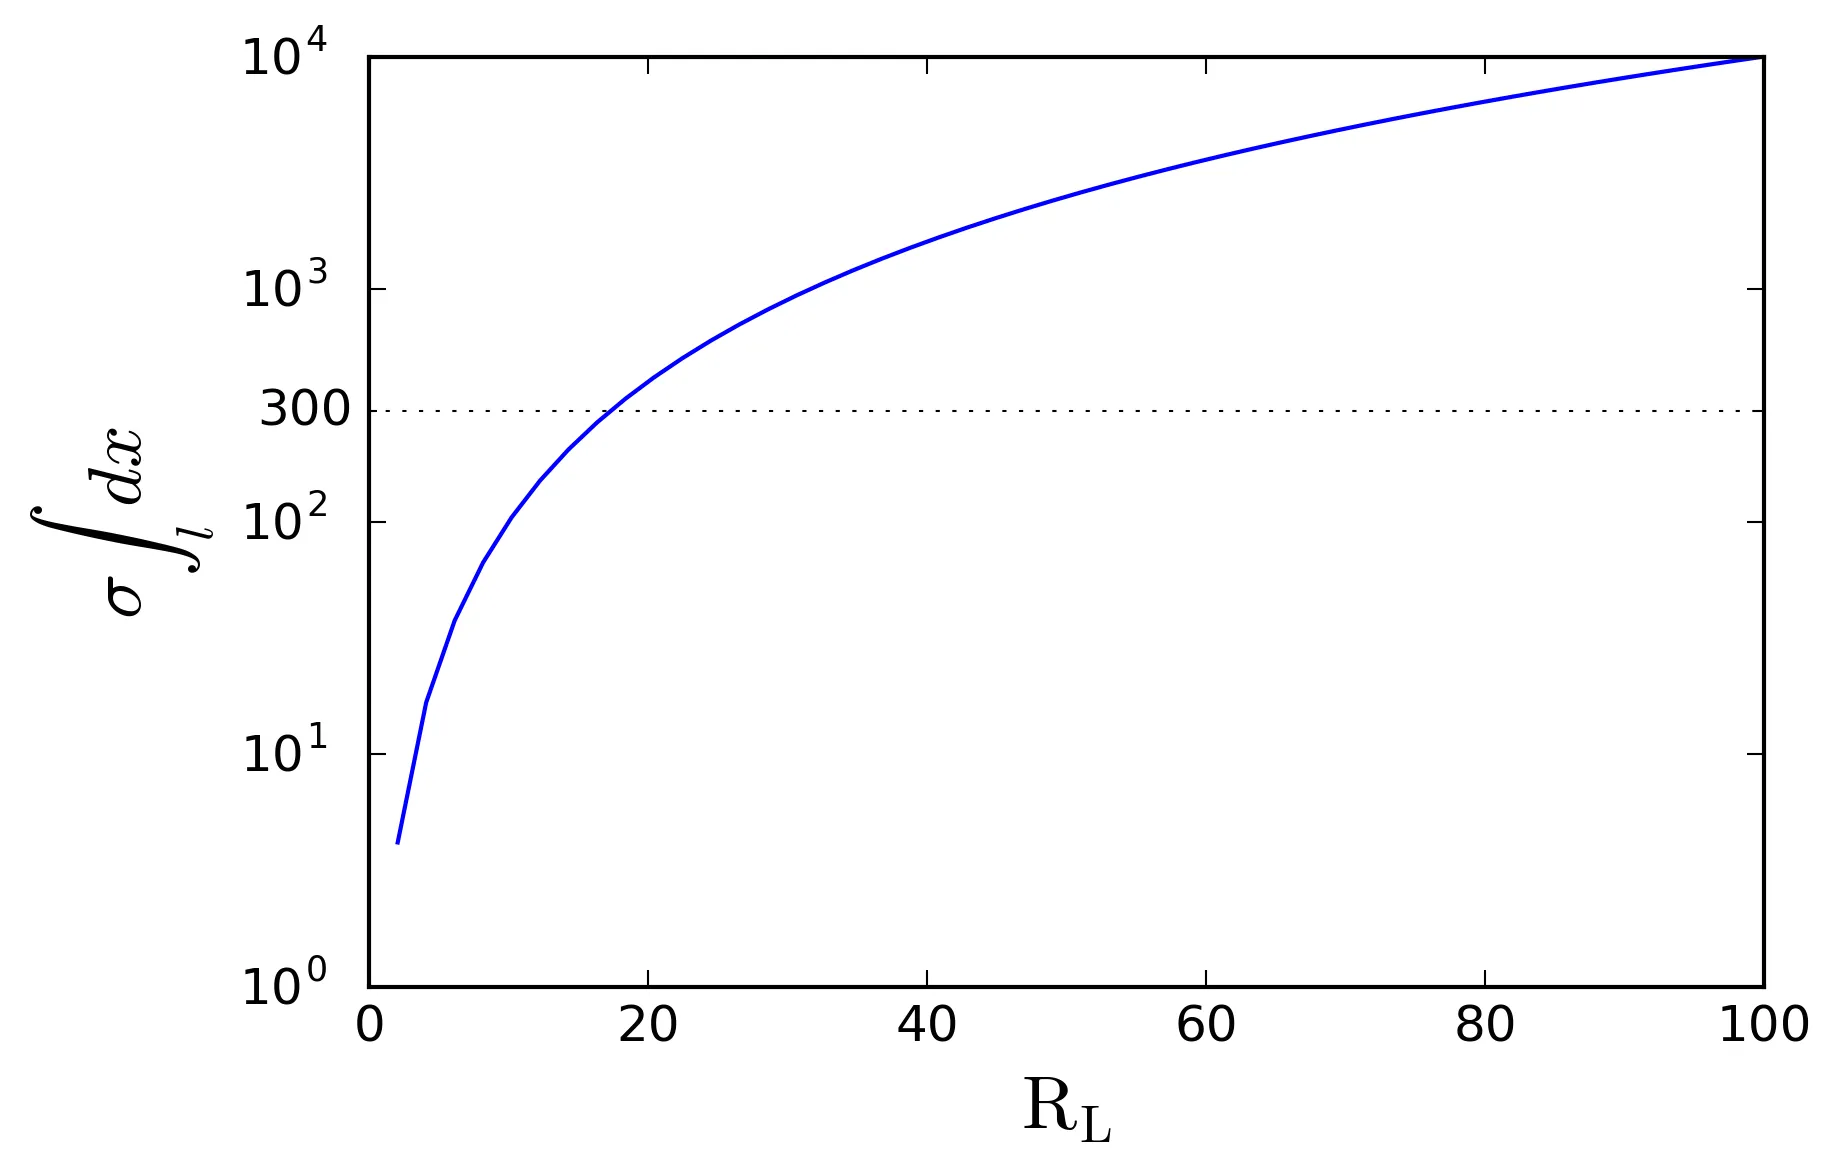
老版本的结果也有一些不同(可能是由于某些latex差异):

enter image description here

但是,期望的结果是从旧版matplotlib中获得的,并在图2中显示。


你链接的文档中写道:“使用内置数学渲染引擎(mathtext)时,默认的数学字体已从“计算机现代”(即类似于LaTeX的字体)更改为“DejaVu Sans”。换句话说,_默认_行为应该是像底部图表一样的无衬线字体。看起来'mathtext.rm': 'serif'是问题的原因,删除它应该可以解决这个问题。 - roganjosh
我尝试了那个更改,但输出结果仍然一样。 - Alex Pacini
我无法复制,所以尝试升级matplotlib,但它现在非常贴心地删除了我的numpy安装,因此我无法测试任何东西。但是数学字体部分也提到了'mathtext.fontset': 'cm',因此也许应该将其删除。我无法确定那行代码的作用。 - roganjosh
1
如果我删除它,我会得到所有的Unicode,这不是我想要的。 我想为latex事物和标签保留一个latex字体,但是坐标轴数字与之前相同(如第二个图中)。为了将anaconda更新到最新版本,我更喜欢从头开始重新安装,有时候这样做更好... - Alex Pacini
1
我正在使用Canopy,但如果我有最新的matplotlib,我本应该期望它是可重现的。然而,我现在在文档中找不到任何明确说明如何实现您的两个目标的内容,所以也许我不想升级,因为这似乎是一个不合逻辑的不匹配,并且没有明确的解决方法。 - roganjosh
显示剩余4条评论
3个回答

4

如果一致性是唯一的问题,您可以使用“Roman”样式,并使用“Times”字体。不需要通过 usetex 使用Latex。相反,只需使用STIX 字体集、 Times 字体和衬线数学文本即可。

import scipy as sc
import matplotlib.style
import matplotlib.pyplot as plt

params = {'legend.fontsize': 18,
          'axes.labelsize': 18,
          'axes.titlesize': 18,
          'xtick.labelsize' :12,
          'ytick.labelsize': 12,
          'grid.color': 'k',
          'grid.linestyle': ':',
          'grid.linewidth': 0.5,
          'mathtext.fontset' : 'stix',
          'mathtext.rm'      : 'serif',
          'font.family'      : 'serif',
          'font.serif'       : "Times New Roman", # or "Times"          
         }
matplotlib.rcParams.update(params)

x = sc.linspace(0,100)
y = x**2
fig = plt.figure('Fig')
ax = fig.add_subplot(1, 1, 1)
lines = ax.semilogy(x, y)

ax.yaxis.set_minor_formatter(matplotlib.ticker.ScalarFormatter())
ax.tick_params(axis='y', pad=10)
ax.set_yticks([300], minor=True)
ax.yaxis.grid(True, which='minor')
ax.set_xlabel(r'$\mathrm{R_L}$')
ax.set_ylabel(r'$\sigma \int_l \; dx$')
plt.tight_layout()
plt.show()

enter image description here


整洁,输出结果很好看且一致。同时我尝试比较了rcParam的字典,并尝试设置不同的元素:结果相当不错。我将尝试将此作为可能的答案(不接受自己的答案,因为我不认为它是最终的)。 - Alex Pacini

1

根据您提供的链接:

提供了一个“经典”样式表,因此将其恢复为1.x默认值只需要一行Python代码

mpl.style.use('classic')

添加此行即可。

matplotlib.style.use('classic')

如果您的脚本按照这个方法进行操作,应该可以解决您的问题。

我在我的python2.7/matplotlib 2上进行了测试,它可以正常工作(即我可以得到matplotlib 1.x字体)。


是的,但那是非常老式的风格。你无法获得第二个图中的相同风格。 我想保留新的风格并修复字体问题。 - Alex Pacini
您IP地址为143.198.54.68,由于运营成本限制,当前对于免费用户的使用频率限制为每个IP每72小时10次对话,如需解除限制,请点击左下角设置图标按钮(手机用户先点击左上角菜单按钮)。 - Eiffel
但是标签中的LaTeX字体不同,看起来很丑。 - Alex Pacini

0
在尝试寻找解决方案时,我尝试比较旧的和新的rcParams字典,并设置与mathtext字体相关且不同的元素:结果相当不错。
代码如下:
#%matplotlib inline
#%matplotlib notebook
#%config InlineBackend.figure_format = 'svg'
import scipy as sc
import matplotlib.pyplot as plt
import matplotlib

# http://matplotlib.org/users/dflt_style_changes.html
params = {'legend.fontsize': 18,
          'axes.labelsize': 18,
          'axes.titlesize': 18,
          'xtick.labelsize' :12,
          'ytick.labelsize': 12,
          'mathtext.fontset': 'cm',
          'mathtext.rm': 'serif',
          'mathtext.bf': 'serif:bold',
          'mathtext.it': 'serif:italic',
          'mathtext.sf': 'sans\\-serif',
          'grid.color': 'k',
          'grid.linestyle': ':',
          'grid.linewidth': 0.5,
         }
matplotlib.rcParams.update(params)
#matplotlib.rcParams.update({'text.usetex':True, 'text.latex.preamble':[r'\usepackage{amsmath, newtxmath}']})
#matplotlib.rcParams.update({'text.usetex':True, 'text.latex.preamble':[r'\usepackage{amsmath, mathptmx}']})
#matplotlib.rcParams.update({'text.usetex':True, 'text.latex.preamble':[r'\usepackage{amsmath}']})

x = sc.linspace(0,100)
y = x**2
fig = plt.figure('Fig')
ax = fig.add_subplot(1, 1, 1)
lines = ax.semilogy(x, y)
ax.set_yticks([300], minor=True)
ax.yaxis.grid(True, which='minor')
ax.yaxis.set_minor_formatter(matplotlib.ticker.ScalarFormatter())
ax.tick_params(axis='y', pad=10)
ax.set_xlabel(r'$\mathrm{R_L}$')
ax.set_ylabel(r'$\sigma \int_l \; dx$')
fig.savefig('./PNG/test.png', dpi=300, bbox_inches='tight')

因此还要添加:
          'mathtext.rm': 'serif',
          'mathtext.bf': 'serif:bold',
          'mathtext.it': 'serif:italic',
          'mathtext.sf': 'sans\\-serif',

导致:

enter image description here

我认为在Latex文档中非常好且一致的是这个。

另一个@ImportanceOfBeingErnest在本帖中的回答也很整洁和漂亮。


网页内容由stack overflow 提供, 点击上面的
可以查看英文原文,
原文链接