我想补充关于图表的额外细节。我该如何添加类似下面图片中的额外细节。
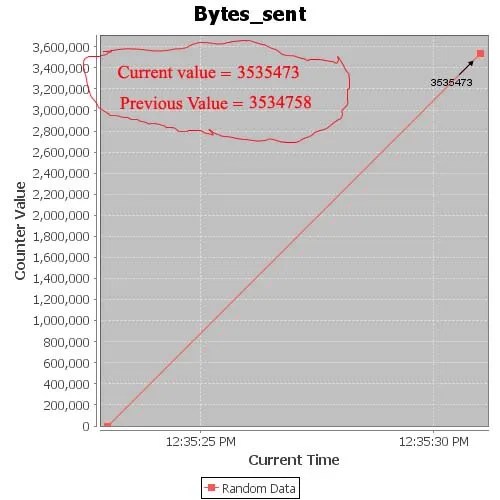
我想补充关于图表的额外细节。我该如何添加类似下面图片中的额外细节。
    final Marker start = new ValueMarker(3400000.0);
    start.setPaint(Color.red);
    start.setLabel("Current Value");
    start.setLabelAnchor(RectangleAnchor.BOTTOM_LEFT);
    start.setLabelTextAnchor(TextAnchor.TOP_LEFT);
    plot.addRangeMarker(start);
34,00,000是计数器的值。根据您的需要设置计数器值。在(x,y)轴上。
// fetch chart as buffered image
BufferedImage image = chart.createBufferedImage(width, height);
// fetch graphics from the buffered image for perform modifications.
Graphics2D g2 = (Graphics2D) image.getGraphics();
g2.setFont(g2.getFont().deriveFont(30f));
g2.setColor(Color.red);
g2.setFont(new Font(Font.SANS_SERIF, Font.PLAIN, fontSize));
String str = "Test String";
float location_x = 200;
float location_y = 200;
// will draw string horizontally
TextUtilities.drawAlignedString(str, g2, location_x,
        location_y, TextAnchor.CENTER_LEFT);
// will draw string Vertically
TextUtilities.drawRotatedString(str, g2, -Math.PI / 2,
        location_x, location_y);
g2.dispose();
// generate png file from the modified buffered image
String path = "/sample/test.png";
try {
  ImageIO.write(image, "png", new File(path));
} catch (IOException e) {
  System.out.println("Error While Creating chart");
  e.printStackTrace();
}
尝试使用注释(例如XYDrawableAnnotation)。以下是一个示例:
http://www.java2s.com/Code/Java/Chart/JFreeChartMarkerDemo1.htm