仅仅使用PHP默认的当前行错误信息来调试PHP代码是很糟糕的。
我该如何在PHP产生错误时获取其回溯(backtrace)(堆栈跟踪)?
仅仅使用PHP默认的当前行错误信息来调试PHP代码是很糟糕的。
我该如何在PHP产生错误时获取其回溯(backtrace)(堆栈跟踪)?
我编写了一个安装错误处理程序以生成回溯的脚本:
<?php
function process_error_backtrace($errno, $errstr, $errfile, $errline, $errcontext) {
    if(!(error_reporting() & $errno))
        return;
    switch($errno) {
    case E_WARNING      :
    case E_USER_WARNING :
    case E_STRICT       :
    case E_NOTICE       :
    case E_USER_NOTICE  :
        $type = 'warning';
        $fatal = false;
        break;
    default             :
        $type = 'fatal error';
        $fatal = true;
        break;
    }
    $trace = array_reverse(debug_backtrace());
    array_pop($trace);
    if(php_sapi_name() == 'cli') {
        echo 'Backtrace from ' . $type . ' \'' . $errstr . '\' at ' . $errfile . ' ' . $errline . ':' . "\n";
        foreach($trace as $item)
            echo '  ' . (isset($item['file']) ? $item['file'] : '<unknown file>') . ' ' . (isset($item['line']) ? $item['line'] : '<unknown line>') . ' calling ' . $item['function'] . '()' . "\n";
    } else {
        echo '<p class="error_backtrace">' . "\n";
        echo '  Backtrace from ' . $type . ' \'' . $errstr . '\' at ' . $errfile . ' ' . $errline . ':' . "\n";
        echo '  <ol>' . "\n";
        foreach($trace as $item)
            echo '    <li>' . (isset($item['file']) ? $item['file'] : '<unknown file>') . ' ' . (isset($item['line']) ? $item['line'] : '<unknown line>') . ' calling ' . $item['function'] . '()</li>' . "\n";
        echo '  </ol>' . "\n";
        echo '</p>' . "\n";
    }
    if(ini_get('log_errors')) {
        $items = array();
        foreach($trace as $item)
            $items[] = (isset($item['file']) ? $item['file'] : '<unknown file>') . ' ' . (isset($item['line']) ? $item['line'] : '<unknown line>') . ' calling ' . $item['function'] . '()';
        $message = 'Backtrace from ' . $type . ' \'' . $errstr . '\' at ' . $errfile . ' ' . $errline . ': ' . join(' | ', $items);
        error_log($message);
    }
    if($fatal)
        exit(1);
}

set_error_handler('process_error_backtrace');
?>
注意:它无法影响各种'PHP致命错误',因为Zend在他们的智慧中决定这些错误将忽略set_error_handler()。所以你仍然会得到那些无用的最终位置错误。
Xdebug在出错时会打印出一个回溯表,您无需编写任何PHP代码即可实现。
缺点是您需要将其安装为PHP扩展程序。
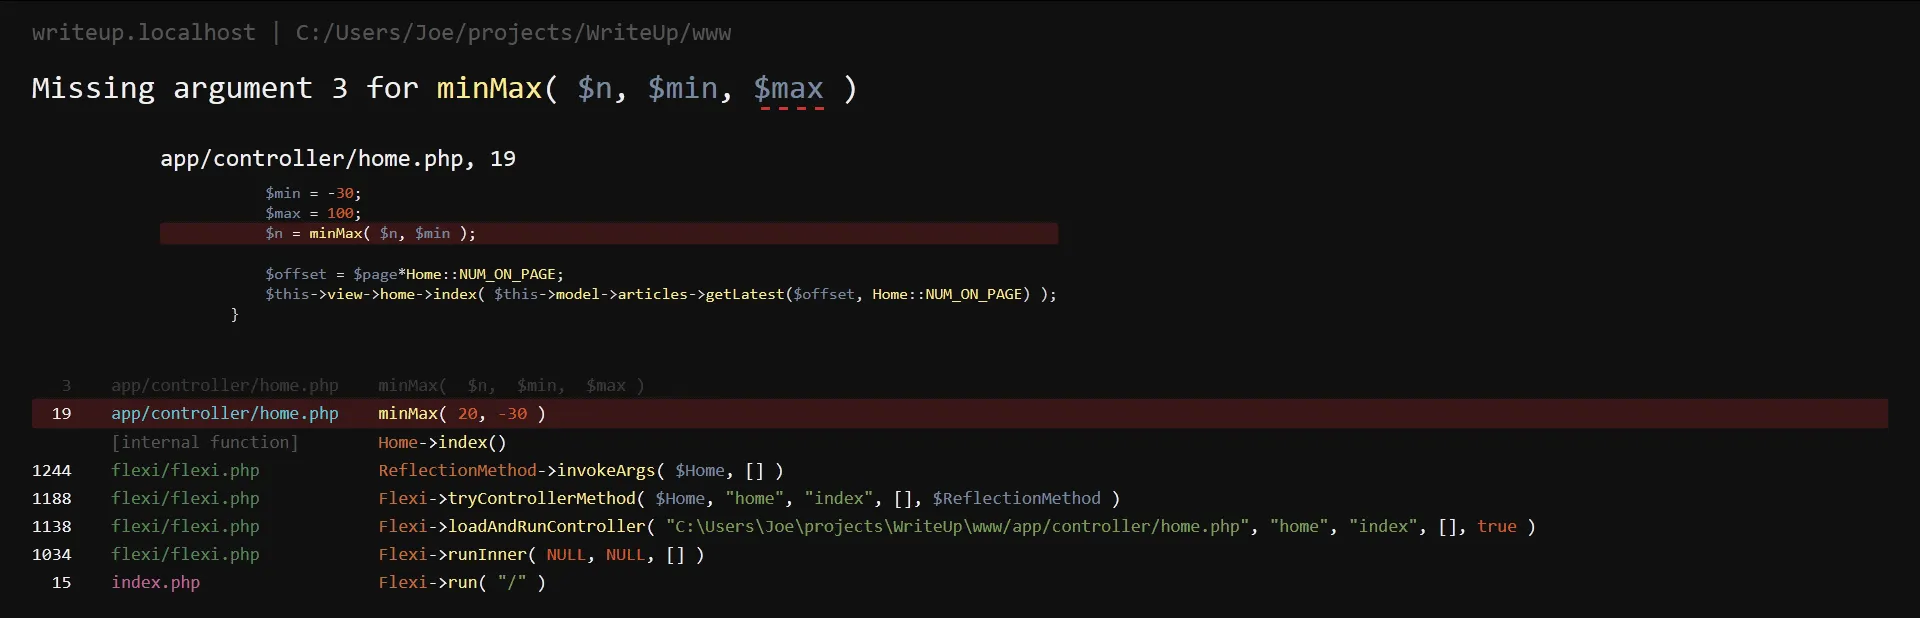
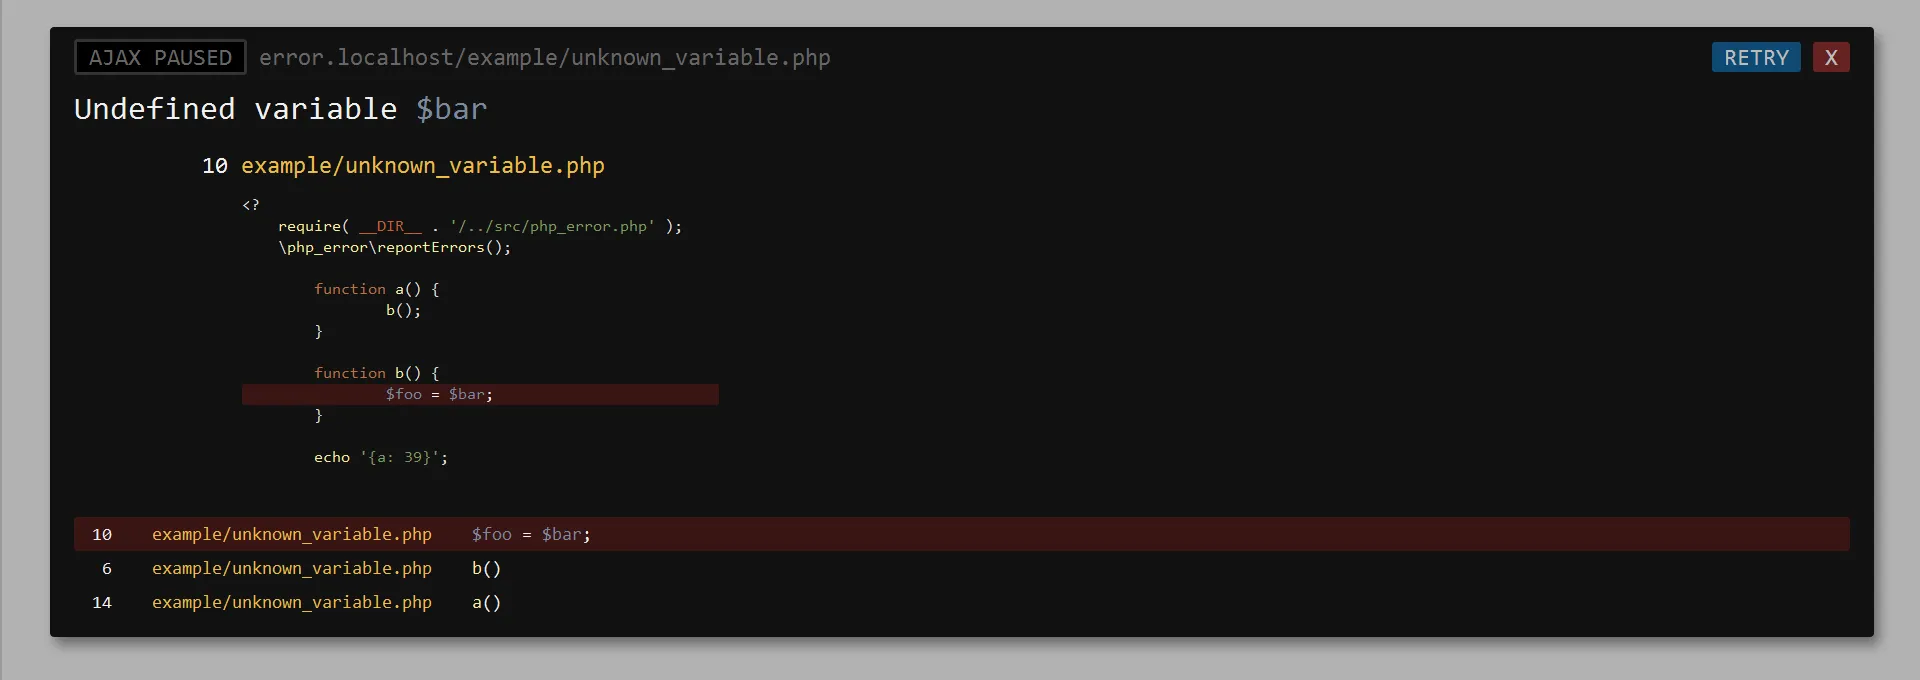
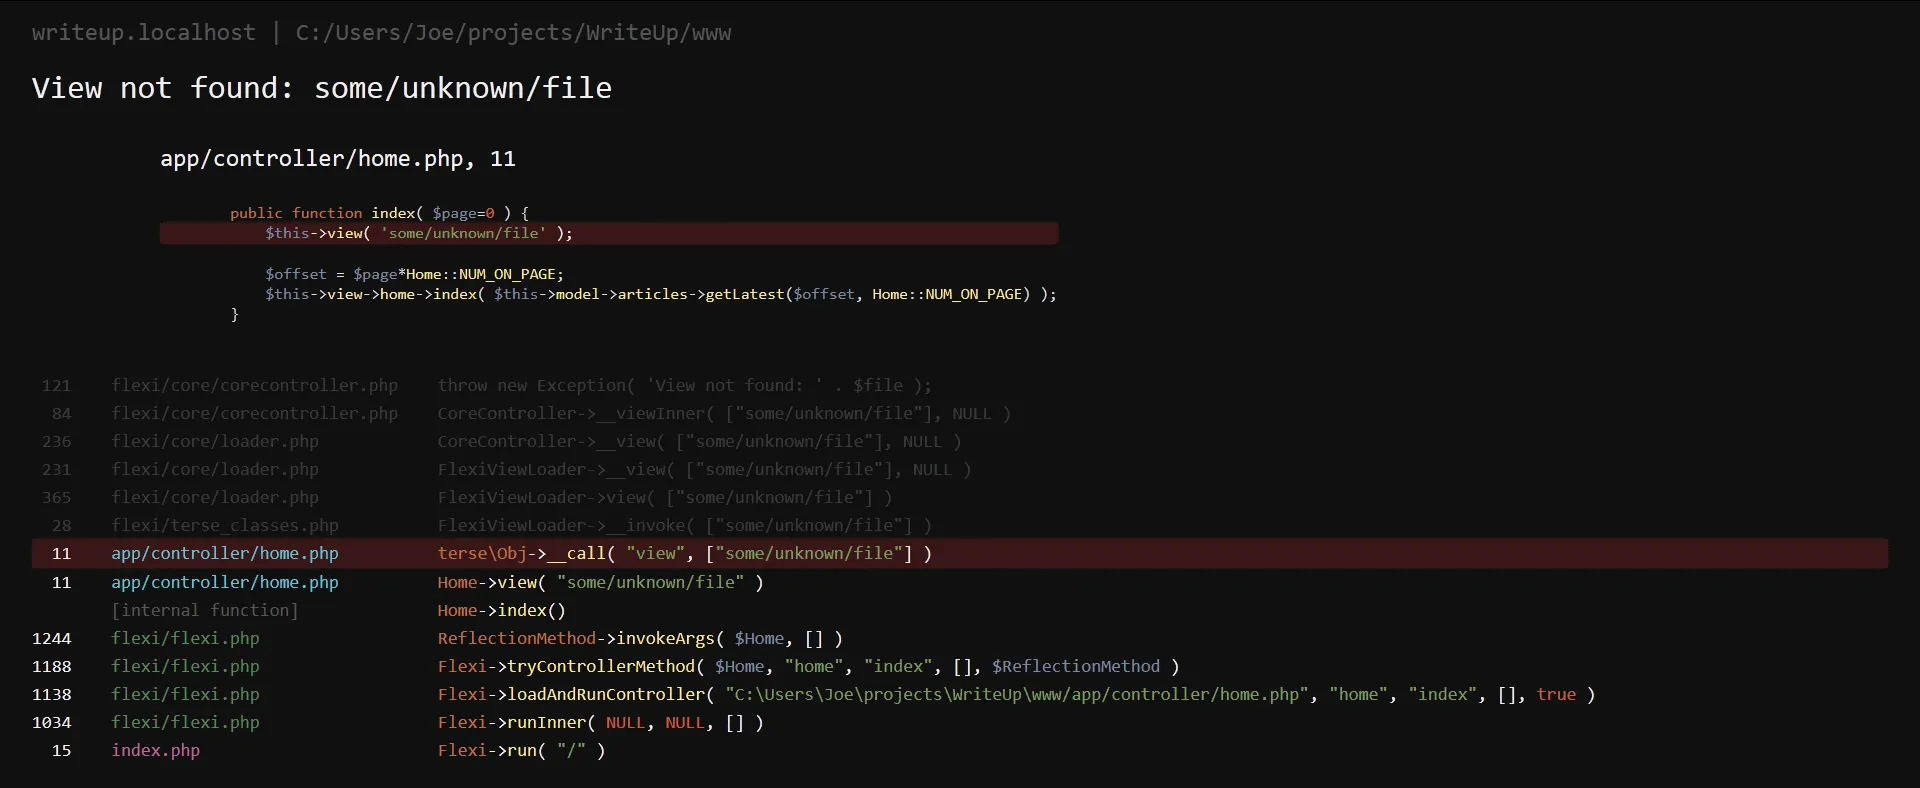
sudo apt-get install php5-xdebug && sudo service php5-fpm restart 对我很有效。谢谢! - Collin Anderson这是一个用PHP编写的更好的PHP错误报告工具。不需要额外的扩展!
它非常容易使用,适用于所有在浏览器中正常显示错误的场景(以暂停状态显示),包括针对AJAX请求。然后,所有的错误都会为您提供整个堆栈跟踪中的回溯和代码上下文,包括函数参数和服务器变量。
您所需做的就是包含一个单独的文件并调用该函数(在您的代码开头),例如:
require('php_error.php');
\php_error\reportErrors();
请查看屏幕截图:
GitHub: https://github.com/JosephLenton/PHP-Error
我的分支(带有额外修复):https://github.com/kenorb-contrib/PHP-Error
一个完整的 PHP 调试器类,支持异常、错误、警报(来自用户)、代码行和高亮标志。
使用示例:
 <?php
        include( dirname(dirname(__FILE__))  . '/src/Debug.php' );
        //Catch all
        Debug::register();

        //Generate an errors
        if( this_function_does_not_exists( ) )
        {
            return false;
        }
    ?>
下面的示例展示了通过触发错误并使用用户定义的函数来处理内部异常:
<?php
function e($number, $msg, $file, $line, $vars) {
   print_r(debug_backtrace());
   die();
}
set_error_handler('e');
// set to the user defined error handler
$old_error_handler = set_error_handler("myErrorHandler");

// error handler function
function myErrorHandler($errno, $errstr, $errfile, $errline)
{
    if (!(error_reporting() & $errno)) {
        // This error code is not included in error_reporting
        return;
    }

    switch ($errno) {
    case E_USER_ERROR:
        echo "<b>My ERROR</b> [$errno] $errstr<br />\n";
        echo "  Fatal error on line $errline in file $errfile";
        echo ", PHP " . PHP_VERSION . " (" . PHP_OS . ")<br />\n";
        echo "Aborting...<br />\n";
        var_dump(debug_backtrace());
        exit(1);
        break;

    case E_USER_WARNING:
        echo "<b>My WARNING</b> [$errno] $errstr<br />\n";
        break;

    case E_USER_NOTICE:
        echo "<b>My NOTICE</b> [$errno] $errstr<br />\n";
        break;

    default:
        echo "Unknown error type: [$errno] $errstr<br />\n";
        break;
    }

    /* Don't execute PHP internal error handler */
    return true;
}
参见: http://www.php.net/manual/zh/function.set-error-handler.php
注意: 一次只能有一个错误异常。当您调用set_error_handler()函数时,它将返回旧错误处理程序的名称。您可以将其存储并从自己的错误处理程序中调用它 - 从而允许您拥有多个错误处理程序。
如果您需要更高级的解决方案,可以使用 PHP 的 XDebug 扩展。
当 XDebug 被加载时,默认情况下,它应该会在出现任何致命错误时自动显示回溯。或者您可以跟踪到文件(xdebug.auto_trace),以获取整个请求的非常大的回溯,或者进行分析(xdebug.profiler_enable)或其他设置。如果跟踪文件太大,您可以使用 xdebug_start_trace() 和 xdebug_stop_trace() 来转储部分跟踪。
安装
使用 PECL:
pecl install xdebug
在Linux上:
sudo apt-get install php5-xdebug
在Mac上(使用Homebrew):
brew tap josegonzalez/php
brew search xdebug
php53-xdebug
我的配置示例:
[xdebug]

; Extensions
extension=xdebug.so
; zend_extension="/YOUR_PATH/php/extensions/no-debug-non-zts-20090626/xdebug.so"
; zend_extension="/Applications/MAMP/bin/php/php5.3.20/lib/php/extensions/no-debug-non-zts-20090626/xdebug.so" ; MAMP

; Data
xdebug.show_exception_trace=1       ; bool: Show a stack trace whenever an exception is raised.
xdebug.collect_vars = 1             ; bool: Gather information about which variables are used in a certain scope.
xdebug.show_local_vars=1            ; int: Generate stack dumps in error situations.
xdebug.collect_assignments=1        ; bool: Controls whether Xdebug should add variable assignments to function traces.
xdebug.collect_params=4             ; int1-4: Collect the parameters passed to functions when a function call is recorded.
xdebug.collect_return=1             ; bool: Write the return value of function calls to the trace files.
xdebug.var_display_max_children=256 ; int: Amount of array children and object's properties are shown.
xdebug.var_display_max_data=1024    ; int: Max string length that is shown when variables are displayed.
xdebug.var_display_max_depth=3      ; int: How many nested levels of array/object elements are displayed.
xdebug.show_mem_delta=0             ; int: Show the difference in memory usage between function calls.

; Trace
xdebug.auto_trace=0                 ; bool: The tracing of function calls will be enabled just before the script is run.
xdebug.trace_output_dir="/var/log/xdebug" ; string: Directory where the tracing files will be written to.
xdebug.trace_output_name="%H%R-%s-%t"     ; string: Name of the file that is used to dump traces into.

; Profiler
xdebug.profiler_enable=0            ; bool: Profiler which creates files read by KCacheGrind.
xdebug.profiler_output_dir="/var/log/xdebug"  ; string: Directory where the profiler output will be written to.
xdebug.profiler_output_name="%H%R-%s-%t"      ; string: Name of the file that is used to dump traces into.
xdebug.profiler_append=0            ; bool: Files will not be overwritten when a new request would map to the same file.

; CLI
xdebug.cli_color=1                  ; bool: Color var_dumps and stack traces output when in CLI mode.

; Remote debugging
xdebug.remote_enable=off            ; bool: Try to contact a debug client which is listening on the host and port.
xdebug.remote_autostart=off         ; bool: Start a remote debugging session even GET/POST/COOKIE variable is not present.
xdebug.remote_handler=dbgp          ; select: php3/gdb/dbgp: The DBGp protocol is the only supported protocol.
xdebug.remote_host=localhost        ; string: Host/ip where the debug client is running.
xdebug.remote_port=9000             ; integer: The port to which Xdebug tries to connect on the remote host.
xdebug.remote_mode=req              ; select(req,jit): Selects when a debug connection is initiated.
xdebug.idekey="xdebug-cli"          ; string: IDE Key Xdebug which should pass on to the DBGp debugger handler.
xdebug.remote_log="/var/log/xdebug.log" ; string: Filename to a file to which all remote debugger communications are logged.
启用Devel的情况下:
/**
 * Implements hook_watchdog().
 */
function foo_watchdog($log_entry) {
  if ($log_entry['type'] == 'php' && $log_entry['severity'] <= WATCHDOG_WARNING) {
    function_exists('dd') && dd(debug_backtrace());
  }
}
/tmp/drupal_debug.txt)。drush eval "echo file_directory_temp() . '/drupal_debug.txt'。var_dump(debug_backtrace());代替dd()。var_dump(debug_backtrace());exit;(并在您的Web浏览器中查看源代码以获得更好的格式)。其他调试工具可能包括 strace、dtrace 等。只要正确使用,就可以找到问题的源头。 - kenorb我刚刚尝试在出错的代码行中设置了一个包含debug_backtrace()内容的会话变量,然后使用register_shutdown_function()打印它。效果非常好。
// Give an extra parameter to the filename
// to save multiple log files
function _fatalog_($extra = false)
{
    static $last_extra;

    // CHANGE THIS TO: A writeable filepath in your system...
    $filepath = '/var/www/html/sites/default/files/fatal-'.($extra === false ? $last_extra : $extra).'.log';

    if ($extra===false) {
        unlink($filepath);
    } else {
        // we write a log file with the debug info
        file_put_contents($filepath, json_encode(debug_backtrace()));
        // saving last extra parameter for future unlink... if possible...
        $last_extra = $extra;
    }
}
// A function which will produce a fatal error
function fatal_example()
{
    _fatalog_(time()); // writing the log
    $some_fatal_code = array()/3; // fatality!
    _fatalog_(); // if we get here then delete last file log
}
var_dump(json_decode(file_get_contents('/path/to-the-fatal.log')));
set_error_handler(function($errorType){
    if(error_reporting() & $errorType){
        ?><pre><?
        debug_print_backtrace();
        ?></pre><?
    }
}) ;
由于使用了闭包,因此需要PHP 5.3+版本。如果您需要更低版本的PHP支持,请将闭包转换为普通函数。
<?= ?> 是允许的。 - happy_marmoset(new \Exception())->getTraceAsString()代替debug_backtrace():set_error_handler(function(int $severity, string $message, string $file, int $line) {
if (!(error_reporting() & $severity)) {
return false;
}
$severities = [
E_ERROR => 'ERROR',
E_WARNING => 'WARNING',
E_PARSE => 'PARSE',
E_NOTICE => 'NOTICE',
E_CORE_ERROR => 'CORE_ERROR',
E_CORE_WARNING => 'CORE_WARNING',
E_COMPILE_ERROR => 'COMPILE_ERROR',
E_COMPILE_WARNING => 'COMPILE_WARNING',
E_USER_ERROR => 'USER_ERROR',
E_USER_WARNING => 'USER_WARNING',
E_USER_NOTICE => 'USER_NOTICE',
E_STRICT => 'STRICT',
E_RECOVERABLE_ERROR => 'RECOVERABLE_ERROR',
E_DEPRECATED => 'DEPRECATED',
E_USER_DEPRECATED => 'USER_DEPRECATED',
];
$e = new \Exception;
// Just remove the current point from the trace
$reflection = new \ReflectionProperty(get_class($e), 'trace');
$reflection->setAccessible(true);
$trace = $reflection->getValue($e);
array_shift($trace);
$reflection->setValue($e, $trace);
$text = '';
$text .= ($severities[$severity] ?? $severity) . ': ';
$text .= "$message in $file($line)\n";
$text .= "Stack trace:\n";
$text .= $e->getTraceAsString();
error_log($text);
if (in_array($severity, [
E_CORE_ERROR,
E_ERROR,
E_RECOVERABLE_ERROR,
E_PARSE,
E_COMPILE_ERROR,
E_USER_ERROR,
], true)) {
http_response_code(500);
exit(255);
}
return true;
});
输出:
[16-Feb-2022 00:01:09 UTC] DEPRECATED: trim(): Passing null to parameter #1 ($string) of type string is deprecated in /home/user/project/doSomething.php(3)
Stack trace:
#0 /home/user/project/doSomething.php(3): trim(NULL)
#1 /home/user/project/index.php(4): doSomething()
#2 {main}
debug_backtrace无法超越关闭函数(堆栈已经被弹出),您可能会对知道在关闭函数中仍然可以访问全局作用域变量感兴趣。 因此,请找到发生E_ERROR的行,并将全局作用域变量设置为前一行中debug_backtrace的内容。 您就拥有了一个完整的回溯,从致命错误之前的行开始,可以从register_shutdown_function定义的函数中访问! - Milo LaMar