ZedGraph填充区域

5
我正在使用ZedGraph控件,希望能够用一种颜色填充图形函数的一侧,另一侧用另一种颜色填充。
 PointPairList list1 = new PointPairList();
 list1.Add(0, 4);
 list1.Add(4, 0);
 LineItem myCurve = myPane.AddCurve("y(n)", list1, Color.Red, SymbolType.Diamond);

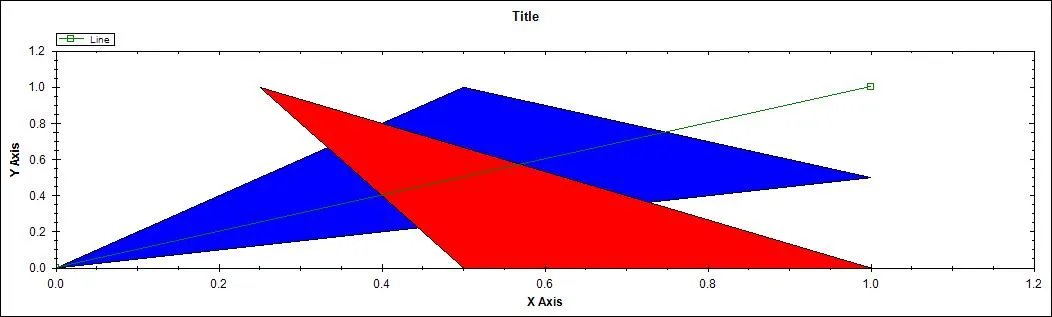
 //This filling bottom side.
 myCurve.Line.Fill = new Fill(Color.White, Color.FromArgb(113, 255, 0, 0), 90F);

 //How to fill the top side?

1
你能不能只添加一个填充作为整个图表的背景,然后第二个填充就像你所做的那样,作为曲线的填充?这应该可以解决问题。或者你有其他想法吗? - Gacek
我按照你说的做了,但我需要填充由多条线相交形成的区域(一些多边形),我能在Zed图中填充一些多边形区域吗? - Sergey
你解决了吗?修改源代码是唯一的方法吗? - edgarmtze
我们应该在这里修改代码吗?https://github.com/lightweightlabs/zedgraph-lw/blob/master/source/ZedGraph/Fill.cs - edgarmtze
1个回答

7
我不是非常清楚你的问题,但希望以下内容能够帮到你。你在评论中提到:

我可以在Zedgraph中填充一些多边形区域吗?

那么这是如何实现的...

var zed = new ZedGraph.ZedGraphControl { Dock = System.Windows.Forms.DockStyle.Fill };

var poly = new ZedGraph.PolyObj
{
    Points = new[]
    {
        new ZedGraph.PointD(0, 0),
        new ZedGraph.PointD(0.5, 1),
        new ZedGraph.PointD(1, 0.5),
        new ZedGraph.PointD(0, 0)
    },
    Fill = new ZedGraph.Fill(Color.Blue),
    ZOrder = ZedGraph.ZOrder.E_BehindCurves
};

var poly1 = new ZedGraph.PolyObj
{
    Points = new[]
    {
        new ZedGraph.PointD(1, 0),
        new ZedGraph.PointD(0.25, 1),
        new ZedGraph.PointD(0.5, 0),
        new ZedGraph.PointD(1, 0)
    },
    Fill = new ZedGraph.Fill(Color.Red),
    ZOrder = ZedGraph.ZOrder.E_BehindCurves
};

zed.GraphPane.AddCurve("Line", new[] { 0.0, 1.0 }, new[] { 0.0, 1.0 }, Color.Green);
zed.GraphPane.GraphObjList.Add(poly1);
zed.GraphPane.GraphObjList.Add(poly);

结果如下:

enter image description here

希望这能为您指明方向!

VB代码请求通过http://converter.telerik.com/转换 - 无法保证VB代码能正常工作或编译!)


你能否发布一个vb.net版本的这个示例呢?我认为这对每个人都非常有帮助。 - edgarmtze
问题已更新。 - dav_i

网页内容由stack overflow 提供, 点击上面的
可以查看英文原文,
原文链接