Plotly表格如何对齐表头垂直和水平

4

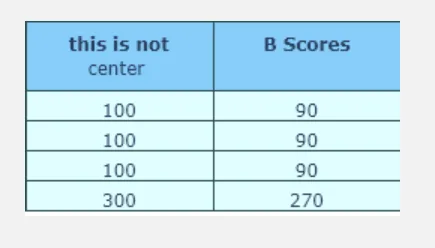
我已经查看了文档,但没有成功。我正在寻找一种解决方案来使标题垂直和水平对齐。水平对齐不适用于第二行(单词"center"不在中心)。两个标题不在同一水平线上,有没有一种解决方案来对齐垂直位置?

import plotly.graph_objects as go

fig = go.Figure(data=[go.Table(
    header=dict(values=['this is not center', 'B Scores'],
                line_color='darkslategray',
                fill_color='lightskyblue',
                align='center'),
    cells=dict(values=[[100, 100, 100, 300], # 1st column
                       [90, 90, 90, 270]], # 2nd column
               line_color='darkslategray',
               fill_color='lightcyan',
               align='center'))
])
fig.update_layout(width=250, height=130)
fig.update_layout(margin=dict(l=0, r=0, t=0, b=0))
fig.show()

感谢您的帮助。

更新:如果我将文本设置为粗体,我可以为标题设置相同的级别。为了将单词“center”放置在中心位置,我使用空格字符。

header=dict(values=['<b>this is not</b><br>   center', '<b>B Scores']

enter image description here


1
你是如何展示你的数据?是用JupyterLab吗?还是其他工具? - vestland
1
我将其保存为图像:plotly.io.write_image(fig, file='table.png', format='png') - Alex
1个回答

0

使用Plotly Dash表格代替

据我所知,Plotly的go.Table内置样式格式自定义功能相当有限。

然而,一个很明显的优秀替代方案是使用Dash(由Plotly开发),更具体地说是使用Dash DataTable内置组件(dash.dash_table.DataTable)。与Plotly表格相比,它允许您在Python代码中直接进行所有HTML和CSS的自定义。

例如,以下内容:

import pandas as pd

import dash
from dash import dcc, html, callback, dash_table
from dash.dependencies import Input, Output, State

df = pd.DataFrame(
    {
        "this is now center": [100, 100, 100, 300],
        "B Scores": [90, 90, 90, 270],
    }
)

app = dash.Dash(__name__)

app.layout = html.Div(
    [
        dash_table.DataTable(
            id="table",
            columns=[{"name": i, "id": i} for i in df.columns],
            data=df.to_dict("records"),
            style_table={"height": "250px", "overflowY": "auto"},
            style_header={
                "backgroundColor": "lightskyblue",
                "fontWeight": "bold",
                "textAlign": "center",
                "verticalAlign": "middle",
            },
            style_cell={
                "textAlign": "center",
                "overflow": "hidden",
                "textOverflow": "ellipsis",
                "maxWidth": 0,
            },
            style_cell_conditional=[
                {
                    "if": {"column_id": "this is now center"},
                    "width": "40%",
                    "whiteSpace": "normal",
                    "padding": "3px",
                },
                {
                    "if": {"column_id": "B Scores"},
                    "width": "40%",
                    "whiteSpace": "normal",
                    "padding": "3px",
                },
            ],
        ),
        html.Br(),
        dcc.Input(
            id="input-box",
            type="text",
            value="B Scores",
            style={"width": "500px"},
        ),
    ],
    style={"width": "200px", "margin": "20px"},
)

# Define callback to update table header
@callback(Output("table", "columns"), [Input("input-box", "value")])
def update_table_header(input_value):
    new_columns = [
        {"name": "this is now center", "id": "this is now center"},
        {"name": input_value, "id": "B Scores"},
    ]
    return new_columns


app.run(jupyter_mode="tab") # Remove the jupyter param if not running from notebook


产出: {{link1:从上面的代码运行的dash应用程序的视频截图录制}}

网页内容由stack overflow 提供, 点击上面的
可以查看英文原文,
原文链接