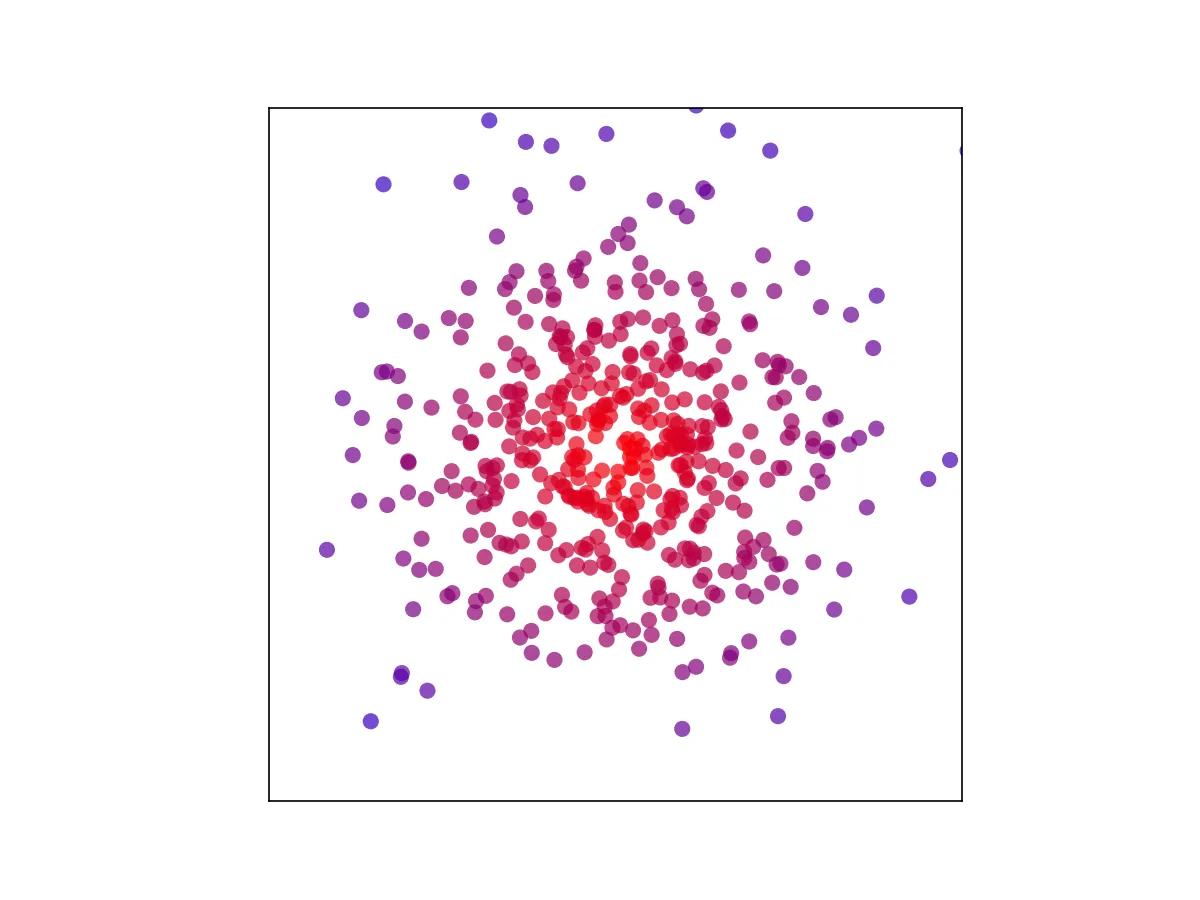
我已经尝试使用Cmaps和if/else语句重新创建附加的图片。
我的当前尝试是基于这个帖子中给出的建议。
我尝试使用1.8<=x<=2.2,但是出现了错误。
下面是我当前的代码:
import numpy as np
import matplotlib.pyplot as plt
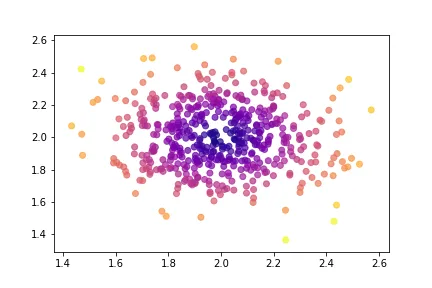
N = 500
# center, variation, number of points
x = np.random.normal(2,0.2,N)
y = np.random.normal(2,0.2,N)
colors = np.where(x<=2.2,'r',np.where(y<=2.2,'b','b'))
plt.scatter(x , y, c=colors)
plt.colorbar()
plt.show()