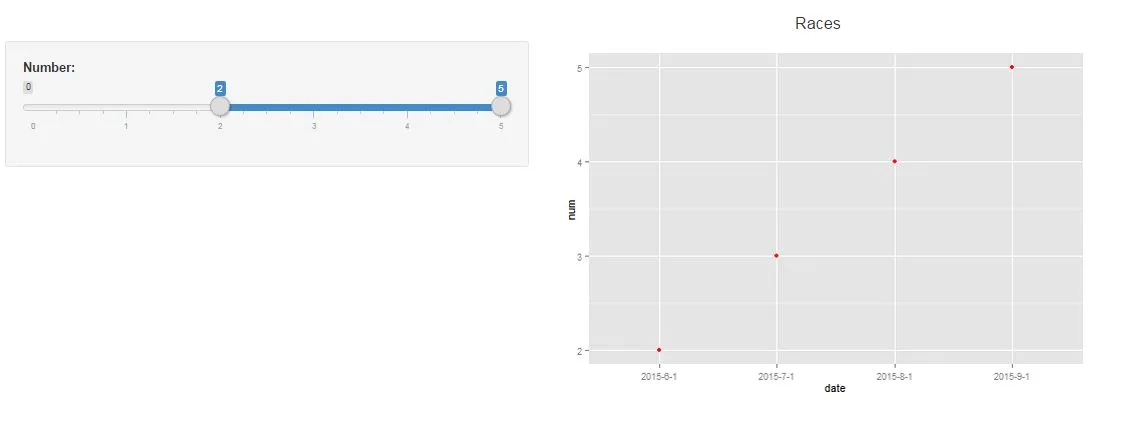
我有一段代码,但无法成功运行。我想基于输入的范围来过滤图表输出。例如,如果范围输入设置为1-5,则希望在图表上看到5个点,同样,输入范围为2-5时则显示4个点。
##UI
require(shiny)
shinyUI(fluidPage(
titlePanel(title=h4("Races", align="center")
),
sidebarPanel(
sliderInput("num", "Number:",
            min = 0, max = 5,step=1,value=c(0,2)),
mainPanel(
  plotOutput("plot2")))))

##server
library(dplyr)
library(ggplot2)
shinyServer(function(input,output){
num<-c(1,2,3,4,5)
let<-c("A","B","C","D","E")
date<-c("2015-5-1","2015-6-1","2015-7-1","2015-8-1","2015-9-1")
df<-data.frame(num,let,date)
dat<-reactive({
df %>% filter(num==input$num)})
output$plot2<-renderPlot({
ggplot(dat(),aes(x=date,y=num))+geom_point(colour='red')},height = 400,
width = 600)})
我想根据输入范围在图表上显示数值范围,但只显示了一个值,而不是相应日期的数值范围。
提前感谢。