当使用
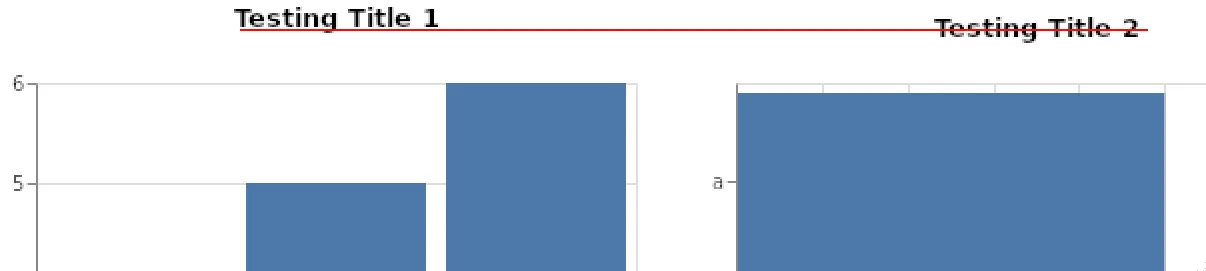
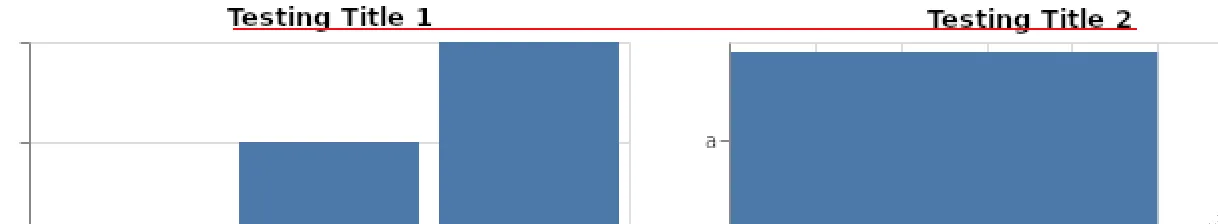
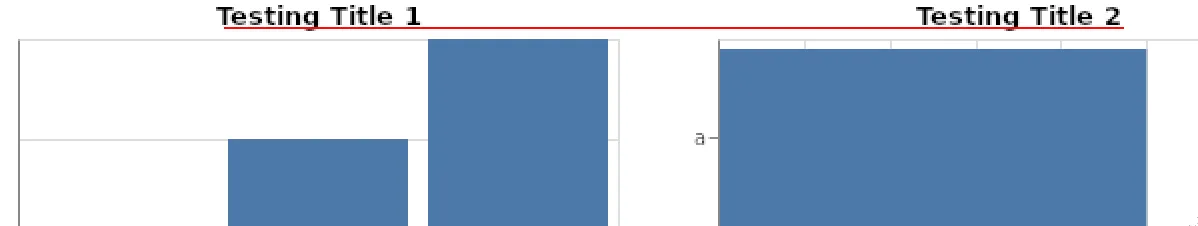
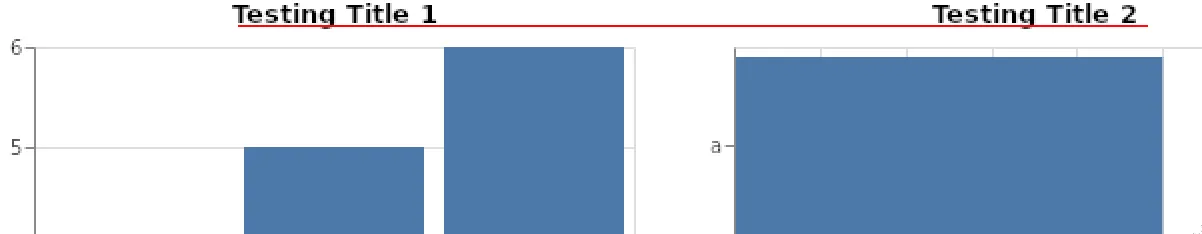
图表标题对不齐。 (由于我显然需要10个声望点才能发布图片,因此无法发布图片。)
alt.hconcat将两个条形图(一个水平,一个垂直)并排显示时,即使图表的高度相等,标题也会错位。是否有办法对齐标题?# Makes test dataframe
test = pd.DataFrame({"group":["a","b","c"],"value1":[4,5,6], "value2":[10,12,14]}).reset_index()
# Sets up vertical bar chart
chart1 = alt.Chart(test).mark_bar().encode(
x = alt.X('group:N'),
y = alt.Y('value1:Q')
).properties(height = 300, width = 300, title = "Testing Title 1")
# Sets up horizontal bar chart
chart2 = alt.Chart(test).mark_bar().encode(
x = alt.X('value2:Q'),
y = alt.Y('group:N')
).properties(height = 300, width = 300, title = "Testing Title 2")
# Shows bar charts side by side
alt.hconcat(chart1, chart2)
图表标题对不齐。 (由于我显然需要10个声望点才能发布图片,因此无法发布图片。)