我有一个包含多个类别的大型数据集。我的目标是为每个类别拟合一个模型,然后预测结果并在一个区块中为每个类别可视化展示。
为了提供可重复的示例,我使用mtcars创建了一些基本内容。这对于每个类别的简单回归模型非常有效。
mtcars = data.table(mtcars)
model = mtcars[, list(fit = list(lm(mpg~disp+hp+wt))), keyby = cyl]
setkey(mtcars, cyl)
mtcars[model, pred := predict(i.fit[[1]], .SD), by = .EACHI]
ggplot(data = mtcars, aes(x = mpg, y = pred)) + geom_line() + facet_wrap(~cyl)
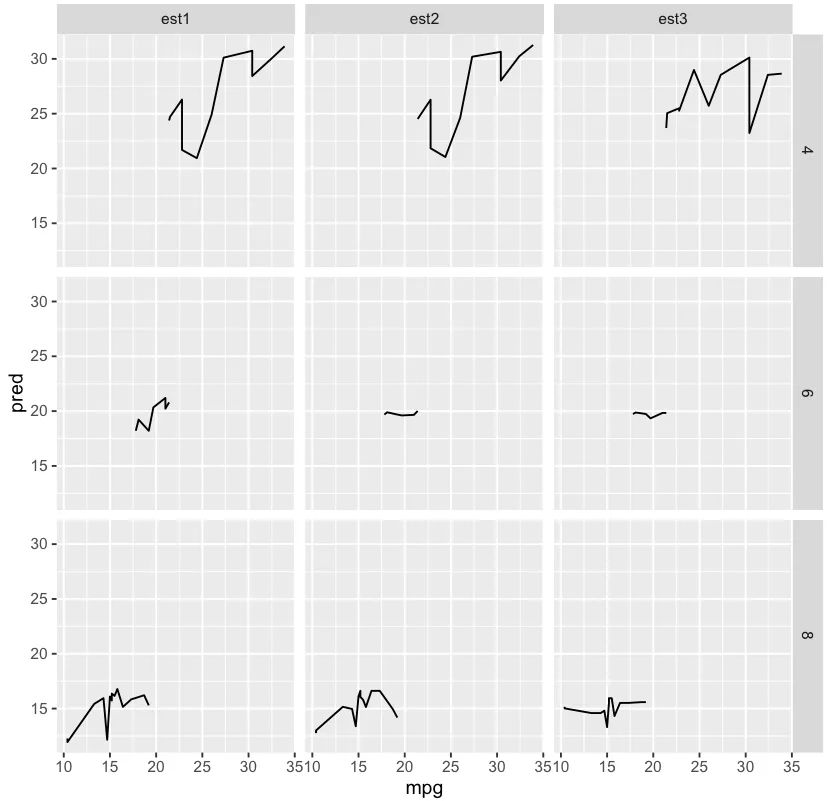
然而,我想尝试以下类似的内容,但目前还没有生效。这次尝试是使用公式列表,但我也想将不同的模型(一些glm,几棵树)发送到每个数据子集。
mtcars = data.table(mtcars)
factors = list(c("disp","wt"), c("disp"), c("hp"))
form = lapply(factors, function(x) as.formula(paste("mpg~",paste(x,collapse="+"))))
model = mtcars[, list(fit = list(lm(form))), keyby = cyl]
setkey(mtcars, cyl)
mtcars[model, pred := predict(i.fit[[1]], .SD), by = .EACHI]
ggplot(data = mtcars, aes(x = mpg, y = pred)) + geom_line() + facet_wrap(~cyl)
list(fit = lapply(form, lm, data = .SD))这个是你想要的吗? - rawr