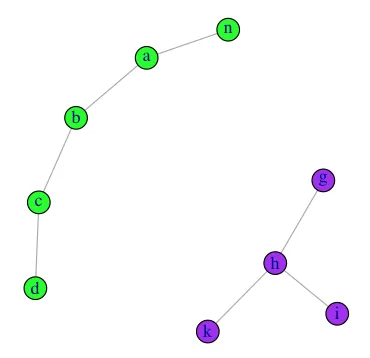
在R中,对于一个向量列表,如何计算交集并集?

19

我有一个向量列表如下。

data <- list(v1=c("a", "b", "c"), v2=c("g", "h", "k"), 
             v3=c("c", "d"), v4=c("n", "a"), v5=c("h", "i"))

我想要实现以下目标:

  1. 检查任何两个向量之间是否相交
  2. 如果找到相交的向量,则获取它们的并集

所以期望的输出是:

out <- list(v1=c("a", "b", "c", "d", "n"), v2=c("g", "h", "k", "i"))

我可以通过以下方式获取一组相交集合的并集。

 Reduce(union, list(data[[1]], data[[3]], data[[4]]))
 Reduce(union, list(data[[2]], data[[5]])

如何首先确定相交向量?有没有一种方法将列表分成相交向量的组列表?

#更新

这里尝试使用data.table。获得所需的结果。但是对于像示例数据集中那样的大列表仍然很慢。

datasets. 
data <- sapply(data, function(x) paste(x, collapse=", "))
data <- as.data.frame(data, stringsAsFactors = F)

repeat {
  M <- nrow(data)
  data <- data.table( data , key = "data" )
  data <- data[ , list(dataelement = unique(unlist(strsplit(data , ", " )))), by = list(data)]
  data <- data.table(data , key = "dataelement" )
  data <- data[, list(data = paste0(sort(unique(unlist(strsplit(data, split=", ")))), collapse=", ")), by = "dataelement"]
  data$dataelement <- NULL
  data <- unique(data)
  N <- nrow(data)
  if (M == N)
    break
}

data <- strsplit(as.character(data$data) , "," )
6个回答

24

这有点像一个图问题,所以我想使用 igraph 库来解决。使用您的样本数据,您可以这样做:

library(igraph)
#build edgelist
el <- do.call("rbind",lapply(data, embed, 2))
#make a graph
gg <- graph.edgelist(el, directed=F)
#partition the graph into disjoint sets
split(V(gg)$name, clusters(gg)$membership)

# $`1`
# [1] "b" "a" "c" "d" "n"
# 
# $`2`
# [1] "h" "g" "k" "i"

我们可以使用以下方式查看结果:

V(gg)$color=c("green","purple")[clusters(gg)$membership]
plot(gg)

这里输入图片描述


好的解决方案,但内存可能成为瓶颈。 - Funkwecker

17

这里是另一种仅使用基础R的方法

更新

在akrun的评论和他提供的示例数据后进行下一次更新:

data <- list(v1=c('g', 'k'), v2= letters[1:4], v3= c('b', 'c', 'd', 'a'))

修改后的函数:

x <- lapply(seq_along(data), function(i) {
  if(!any(data[[i]] %in% unlist(data[-i]))) {
    data[[i]]
  } else if (any(data[[i]] %in% unlist(data[seq_len(i-1)]))) {
    NULL 
  } else {
    z <- lapply(data[-seq_len(i)], intersect,  data[[i]]) 
    z <- names(z[sapply(z, length) >= 1L])
    if (is.null(z)) NULL else union(data[[i]], unlist(data[z]))
  }
})
x[!sapply(x, is.null)]
#[[1]]
#[1] "g" "k"
#
#[[2]]
#[1] "a" "b" "c" "d"

这在原始示例数据、MrFlick的示例数据和akrun的示例数据上都很有效。


1
@Crops,说得好!我用一个修改过的函数更新了我的答案。 - talat
1
这段代码似乎无法很好地处理样本数据:data <- list(v1=c("a", "b"), v2=c("b", "c"), v3=c("a", "d"), v4=c("g", "k"), v5=c("c", "d"))。它还会将不完整的子集作为正确的分组返回。 - MrFlick
1
很好的发现,@MrFlick!我又更新了我的答案。 - talat
1
@Crops,我会检查一下,但是你链接的数据是一个只有1列的数据框。每行目前都有一个字符串。你如何将其转换为类似于你问题中的列表?你能否提供一个文本文件,其中包含dput(data)的输出,其中data已正确格式化为列表?这将确保我们使用相同的数据进行操作。 - talat
1
@Crops,仍然存在一些意外情况。我将努力修复它,但现在没有足够的时间。请随意接受MrFlick的优质答案。 - talat
显示剩余9条评论

9

效率可见鬼了,你们还睡觉吗?仅限于基本R语言,比最快的答案慢得多。既然我写了它,就不妨发布一下。

f.union = function(x) {
  repeat{
    n = length(x)
    m = matrix(F, nrow = n, ncol = n)
    for (i in 1:n){
      for (j in 1:n) {
        m[i,j] = any(x[[i]] %in% x[[j]])
      }
    }
    o = apply(m, 2, function(v) Reduce(union, x[v]))
    if (all(apply(m, 1, sum)==1)) {return(o)} else {x=unique(o)}
  }
}

f.union(data)

[[1]]
[1] "a" "b" "c" "d" "n"

[[2]]
[1] "g" "h" "k" "i"

因为我喜欢慢一些。(在基准测试之外加载了库)


Unit: microseconds
    expr      min        lq      mean    median        uq       max neval
   vlo()  896.435 1070.6540 1315.8194 1129.4710 1328.6630  7859.999  1000
 akrun()  596.263  658.6590  789.9889  694.1360  804.9035  3470.158  1000
 flick()  805.854  928.8160 1160.9509 1001.8345 1172.0965  5780.824  1000
  josh() 2427.752 2693.0065 3344.8671 2943.7860 3524.1550 16505.909  1000 <- deleted :-(
   doc()  254.462  288.9875  354.6084  302.6415  338.9565  2734.795  1000

我太累了。要去睡觉了。我想可能有第五个答案需要RGBL,但我可能只是在想象。你的解决方案是最快的。 - Vlo
1
好的,RBGL是一种很酷的Bioconductor软件包。我刚刚运行了作者删除的第五个答案。 - Vlo
咖啡!因为你可以在死后睡觉! - Carl Witthoft

8

一种选择是使用combn,然后找到交集。还有更简单的选项。

indx <- combn(names(data),2)
lst <- lapply(split(indx, col(indx)), 
        function(i) Reduce(`intersect`,data[i]))
indx1 <- names(lst[sapply(lst, length)>0])
indx2 <- indx[,as.numeric(indx1)]
indx3 <- apply(indx2,2, sort)
lapply(split(1:ncol(indx3), indx3[1,]),
   function(i) unique(unlist(data[c(indx3[,i])], use.names=FALSE)))
#$v1
#[1] "a" "b" "c" "d" "n"

#$v2
#[1] "g" "h" "k" "i"

更新

您可以使用library(gRbase)中的combnPrim使此过程更快。 使用稍大的数据集

library(gRbase)
set.seed(25)
data <- setNames(lapply(1:1e3,function(i)sample(letters,
         sample(1:20), replace=FALSE)), paste0("v", 1:1000))

这些都是基于OP对@docendo discimus的评论修改后的函数,并与最快进行比较。

akrun2M <- function(){
     ind <- sapply(seq_along(data), function(i){#copied from @docendo discimus
            !any(data[[i]] %in% unlist(data[-i]))
              })
     data1 <- data[!ind] 
     indx <- combnPrim(names(data1),2)
     lst <- lapply(split(indx, col(indx)), 
              function(i) Reduce(`intersect`,data1[i]))
     indx1 <- names(lst[sapply(lst, length)>0])
     indx2 <- indx[,as.numeric(indx1)]
     indx3 <- apply(indx2,2, sort)
     c(data[ind],lapply(split(1:ncol(indx3), indx3[1,]),
        function(i) unique(unlist(data[c(indx3[,i])], use.names=FALSE))))
   } 

doc2 <- function(){
      x <- lapply(seq_along(data), function(i) {
          if(!any(data[[i]] %in% unlist(data[-i]))) {
               data[[i]]
           } 
          else {
            z <- unlist(data[names(unlist(lapply(data[-c(1:i)],
                                     intersect, data[[i]])))]) 
          if (is.null(z)){ 
               z
               }
          else union(data[[i]], z)
        }
   })
x[!sapply(x, is.null)]
}

基准测试

 microbenchmark(doc2(), akrun2M(), times=10L)
 # Unit: seconds
 #    expr      min       lq     mean   median       uq      max neval  cld
 #   doc2() 35.43687 53.76418 54.77813 54.34668 62.86665 67.76754    10   b
 #akrun2M() 26.64997 28.74721 38.02259 35.35081 47.56781 49.82158    10   a 

1
我几天前写了这个,只是想让你知道我用了你的解决方案的最后两行,所以我想感谢你。它很稳定但是相当慢。我在考虑用lapply或类似的东西来替换所有的 for 循环。 - Anoushiravan R
1
@AnoushiravanR 我简直无法想象我写了这个。在几年后看起来对我来说都很陌生 :-) - akrun
1
哈哈哈,只是在想当你几年前写这个的时候我在干嘛。我当时处于完全的黑暗中。我正在寻找一个替代方案来回答我的问题,然后就想到了这个,但我必须学习igraph,它非常有用。 一切都始于这里:https://dev59.com/hV4c5IYBdhLWcg3wzs6Q - Anoushiravan R
1
亲爱的阿伦,我不想再浪费你的时间了,你今天一如既往地非常慷慨。我不知道该怎么感谢你。 - Anoushiravan R

4

我遇到了一个相似的问题,促使我四处寻找解决方案。最终,在这里有许多优秀的贡献者的帮助下,我找到了一个非常好的解决方案,但是当我看到这篇文章时,我想为此编写自己的自定义函数。它实际上不够优雅,速度也比较慢,但我认为它相当有效,可以暂时解决问题,直到我做一些改进为止:

anoush <- function(x) {
# First we check whether x is a list

  stopifnot(is.list(x)) 

# Then we take every element of the input and calculate the intersect between
# that element & others. In case there were some we would store the indices 
# in `vec` vector. So in the end we have a list called `ind` whose elements 
# are all the indices connected with the corresponding elements of the original 
# list for example first element of `ind` is `1`, `2`, `3` which means in 
# the original list these elements have common values.
  
  ind <- lapply(1:length(x), function(a) {
    vec <- c()
    for(i in 1:length(x)) {
      if(length(unique(base::intersect(x[[a]], x[[i]]))) > 0) {
        vec <- c(vec, i)
      }
    }
    vec 
    })

# Then we go on to again compare each element of `ind` with other elements
# in case there were any intersect, we will calculate the `union` of them.
# for each element we will end up with a list of accumulated values but
# but in the end we use `Reduce` to capture only the last one. So for each
# element of `ind` we end up having a collection of indices that also 
# result in duplicated values. For example elements `1` through `5` of 
# `dup_ind` contains the same value cause in the original list these 
# elements have common values.

  dup_ind <- lapply(1:length(ind), function(a) {
    out <- c()
    for(i in 1:length(ind)) {
      if(length(unique(base::intersect(ind[[a]], ind[[i]]))) > 0) {
        out[[i]] <- union(ind[[a]], ind[[i]])
      }
      vec2 <- Reduce("union", out)
    }
    vec2
  }) 

# Here we get rid of the duplicated elements of the list by means of 
# `relist` funciton and since in this process all the duplicated elements
# will turn to `integer(0)` I have filtered those out.
  
  un <- unlist(dup_ind)
  res <- Map(`[`, dup_ind, relist(!duplicated(un), skeleton = dup_ind))
  res2 <- Filter(length, res)
  
  sapply(res2, function(a) unique(unlist(lapply(a, function(b) `[[`(x, b)))))
  
}

原始数据样本

> anoush(data)

[[1]]
[1] "a" "b" "c" "d" "n"

[[2]]
[1] "g" "h" "k" "i"

亲爱的@akrun数据样本

data <- list(v1=c('g', 'k'), v2= letters[1:4], v3= c('b', 'c', 'd', 'a'))

> anoush(data)
[[1]]
[1] "g" "k"

[[2]]
[1] "a" "b" "c" "d"

0
一般来说,你很难找到比 Floyd-Warshall 算法更好/更快的算法,它的具体实现如下:
library(Rcpp)

cppFunction(
  "LogicalMatrix floyd(LogicalMatrix w){
    int n = w.nrow();
    for( int k = 0; k < n; k++ )
     for( int i = 0; i < (n-1); i++ )
      for( int j = i+1; j < n; j++ ) 
       if( w(i,k) && w(k,j) ) {
        w(i,j) = true;
        w(j,i) = true;
       }
   return w;
}")

fw.union<-function(x) {
  n<-length(x)
  w<-matrix(F,nrow=n,ncol=n)
  for( i in 1:n ) {
   w[i,i]<-T
  }
  for( i in 1:(n-1) ) {
   for( j in (i+1):n ) {
     w[i,j]<-w[j,i]<- any(x[[i]] %in% x[[j]])
   }
  }
 apply( unique( floyd(w) ), 1, function(y) { Reduce(union,x[y]) } )
}

运行基准测试会很有趣。初步测试表明,我的实现大约比Vlo的快2-3倍。


网页内容由stack overflow 提供, 点击上面的
可以查看英文原文,
原文链接