Bokeh自定义JS回调日期范围滑块

4
我想创建一个交互式图表,可以在 X 轴上绘制日期,Y 轴上绘制值 Y。目前来看还不错。现在我想通过 DateRangeSlider 调整 x 轴的限制 xmin 和 xmax,但是我不明白 js 回调函数(最终我想获得一个独立的html文件),而且由于我不知道如何从函数内部打印值且不产生任何错误,所以现在我不知道该怎么做。
以下是代码的运行示例:
import numpy as np
import pandas as pd
from datetime import datetime
from bokeh.models import ColumnDataSource, DatetimeTickFormatter, HoverTool
from bokeh.models.widgets import DateRangeSlider
from bokeh.layouts import layout, column
from bokeh.models.callbacks import CustomJS
from bokeh.plotting import figure, output_file, show, save

datesX = pd.date_range(start='1/1/2018', periods=100)
valuesY = pd.DataFrame(np.random.randint(0,25,size=(100, 1)), columns=list('A'))

source = ColumnDataSource(data={'x': datesX, 'y': valuesY['A']}) 

# output to static HTML file
output_file('file.html')

hover = HoverTool(tooltips=[('Timestamp', '@x{%Y-%m-%d %H:%M:%S}'), ('Value', '@y')],
                           formatters={'x': 'datetime'},)
    
date_range_slider = DateRangeSlider(title="Zeitrahmen", start=datesX[0], end=datesX[99], \
                                        value=(datesX[0], datesX[99]), step=1, width=300)

# create a new plot with a title and axis labels
p = figure(title='file1', x_axis_label='Date', y_axis_label='yValue',  x_axis_type='datetime', 
               tools="pan, wheel_zoom, box_zoom, reset", plot_width=300, plot_height=200)

# add a line renderer with legend and line thickness
    
p.line(x='x', y='y', source=source, line_width=2)
p.add_tools(hover)
       
callback = CustomJS(args=dict(source=source), code="""

    ##### what to do???

    source.change.emit();
    """)
    
date_range_slider.js_on_change('value', callback)
layout = column(p, date_range_slider)

# show the results
show(layout)

我尝试根据stackoverflow上的其他人和bokeh示例进行调整和适应,但我没有成功生成运行代码。希望一切清楚,您能提供帮助。
4个回答

3
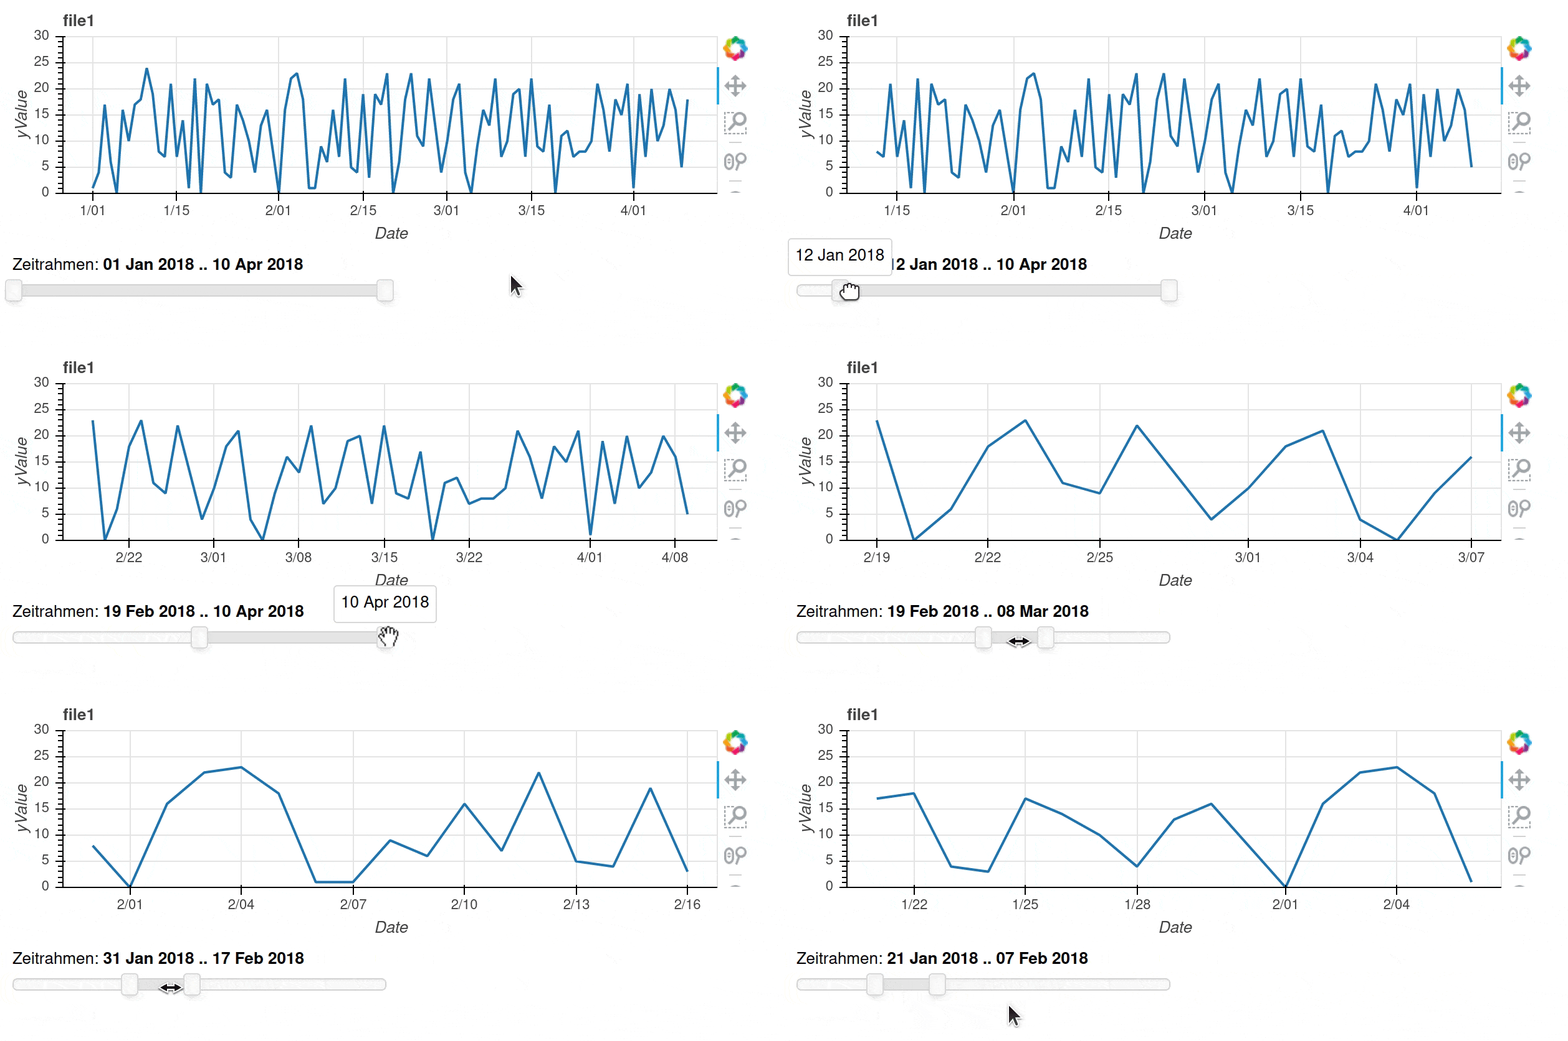
当更改滑块时,您需要创建一个新的source.data。为此,您还需要一个“备份” source,您进行更改,并用作要包括哪些数据的参考。将两者作为参数传递给回调函数可使它们在Javascript代码中可用。
datesX = pd.date_range(start='1/1/2018', periods=100)
valuesY = pd.DataFrame(np.random.randint(0,25,size=(100, 1)), columns=list('A'))

# keep track of the unchanged, y-axis values
source = ColumnDataSource(data={'x': datesX, 'y': valuesY['A']}) 
source2 = ColumnDataSource(data={'x': datesX, 'y': valuesY['A']})

# output to static HTML file
output_file('file.html')

hover = HoverTool(
    tooltips=[('Timestamp', '@x{%Y-%m-%d %H:%M:%S}'), ('Value', '@y')],
    formatters={'x': 'datetime'},)
    
date_range_slider = DateRangeSlider(
    title="Zeitrahmen", start=datesX[0], end=datesX[99],
    value=(datesX[0], datesX[99]), step=1, width=300)

# create a new plot with a title and axis labels
p = figure(
    title='file1', x_axis_label='Date', y_axis_label='yValue',
    y_range=(0, 30), x_axis_type='datetime',
    tools="pan, wheel_zoom, box_zoom, reset",
    plot_width=600, plot_height=200)

# add a line renderer with legend and line thickness
    
p.line(x='x', y='y', source=source, line_width=2)
p.add_tools(hover)

callback = CustomJS(args=dict(source=source, ref_source=source2), code="""
    
    // print out array of date from, date to
    console.log(cb_obj.value); 
    
    // dates returned from slider are not at round intervals and include time;
    const date_from = Date.parse(new Date(cb_obj.value[0]).toDateString());
    const date_to = Date.parse(new Date(cb_obj.value[1]).toDateString());
    
    const data = source.data;
    const ref = ref_source.data;
    
    const from_pos = ref["x"].indexOf(date_from);
    // add + 1 if you want inclusive end date
    const to_pos = ref["x"].indexOf(date_to);
        
    // re-create the source data from "reference"
    data["y"] = ref["y"].slice(from_pos, to_pos);
    data["x"] = ref["x"].slice(from_pos, to_pos);
    
    source.change.emit();
    """)
    
date_range_slider.js_on_change('value', callback)
layout = column(p, date_range_slider)

# show the results
show(layout)

enter image description here


一开始看起来像是我想要的,但接下来我想要的是绘制可见数据的线性趋势线。把不可见范围设置为-100可能不是正确的解决方案。我会调整一下,或许能实现我想要的效果。 - thommy bee
我运行了代码,但找不到输出,一定是我的问题 ¯\ (ツ) /¯ - thommy bee
1
这将出现在您浏览器开发工具的控制台部分 - 在Firefox中为Ctrl + Shift + K,在Chrome中为F12 - gherka
这对我来说真的是一个非常有帮助的答案!您认为如果在日期范围内没有每个时间戳的数据点,使用日期范围滑块是否有意义?我遇到了一个数据集的问题,其中每隔一天就有一个数据点。Array.indexOf在这种情况下不起作用,我使用了x的过滤和基于过滤数组的端点索引切片y。图表可以工作,但是bokeh仍然给我一个错误,即源列长度不一致,尽管当我记录它们的长度时,它们是相等的。 - Greg
请查看下面 @Paul Whitney 的答案,不需要使用 JS! - ibarrond
显示剩余7条评论

2

我发现上面的答案不起作用,因为ref_source数据的时间戳与来自bokeh滑块对象(cb_obj)的解析时间戳不同。

例如,当使用new Date(source.data.["x"]);解析ref_source数据的时间戳时,会创建以下输出:

01/01/2020 02:00:00

来自bokeh滑块对象cb_obj的时间戳始终具有00:00:00的时间。因此,在使用const from_pos = ref["date"].indexOf(date_from);时找不到时间戳。

为了正确解析ref_source中的日期,我创建了一个新数组new_ref,并将正确解析的日期添加到该数组中。但是,我必须强调,我不是JavaScript专家,我相信这里的代码可以更有效地编写。

这是我的工作示例:

// print out array of date from, date to
console.log(cb_obj.value); 

// dates returned from slider are not at round intervals and include time;
const date_from = Date.parse(new Date(cb_obj.value[0]).toDateString());
const date_to = Date.parse(new Date(cb_obj.value[1]).toDateString());
console.log(date_from, date_to)

// Creating the Data Sources
const data = source.data;
const ref = ref_source.data;

// Creating new Array and appending correctly parsed dates
let new_ref = []
ref["x"].forEach(elem => {
    elem = Date.parse(new Date(elem).toDateString());
    new_ref.push(elem);
    console.log(elem);
})

// Creating Indices with new Array
const from_pos = new_ref.indexOf(date_from);
const to_pos = new_ref.indexOf(date_to) + 1;


// re-create the source data from "reference"
data["y"] = ref["y"].slice(from_pos, to_pos);
data["x"] = ref["x"].slice(from_pos, to_pos);

source.change.emit();

我希望我的翻译对您有所帮助:)


非常感谢,最终这就是正确的解决方案。我不知道@gherka是如何制作他的gif的,因为只有你的代码做到了正确的事情。 - thommy bee

1

有趣的问题和讨论。添加以下两行代码(其中一行直接从文档中提取)可以使滑块不使用CustomJS和js_on_change函数工作 - 而是使用js_link函数:

date_range_slider.js_link('value', p.x_range, 'start', attr_selector=0)
date_range_slider.js_link('value', p.x_range, 'end', attr_selector=1)

上帝保佑你。这应该是最近版本的bokeh的默认答案。没有自定义JS代码。干净整洁! - ibarrond

0

我和 @Jan Burger 有类似的成功经验,但是我使用了 CustomJS 直接更改绘图的 x_range 而不是过滤数据源。

callback = CustomJS(args=dict(p=p), code="""
    p.x_range.start = cb_obj.value[0]
    p.x_range.end = cb_obj.value[1]
    p.x_range.change.emit()
    """)

date_range_slider.js_on_change('value_throttled', callback)

网页内容由stack overflow 提供, 点击上面的
可以查看英文原文,
原文链接