挑战在于 REBOL(R2 和 R3)中的分析有三个方面。时间、循环和内存使用。
时间:
在某些操作系统上,缺省时间不是很精确(如 Windows)。通过创建更大的循环,可以基本上将测试缩放到可接受的时间范围内,从而在很大程度上减轻这种情况。您还可以创建更好的定时器,例如我为 Windows 构建的 chrono lib(
chrono-lib.r)。它还包括一个时间间隔函数,使得测试块变得容易(基本上是 Windows 更精确的“DT”)。
循环:
这是一个明显的事情,当你计算时间时,为了消除一些操作系统/多任务处理开销,你会运行代码多次并将重复次数分割以获得平均值。这通常足以获得一个很好的想法。
但是,在rebol中,循环本身就是相当昂贵的。迭代函数有自己的非微不足道的开销。因此,在循环一些代码之前,请确保您使用的循环是最优的,特别确保您使用本地迭代器函数,因为循环可能会比您尝试分析的代码更慢。在R2中,FOREACH和LOOP是大多数情况下更快的循环。FOREACH在开始循环之前具有一点绑定开销,但在我的广泛测试中,这对于运行几秒钟而言是无法测量的影响,因为它仅发生一次并且在运行期间无关紧要。
在R3中,迭代器函数由于R2的一些mezz循环已成为本地循环而得到了加速,因此您必须检查它们以查看它们是否更快。
内存:
这是事情变得不太可预测的地方。REBOL的GC在分析时相当入侵。它不仅很慢,而且不可预测,不能被实际优化,并且随着REBOL的内存占用增加而减慢(实际上比人们意识到的要多得多)。
到底减慢了多少?让我们看看:
这是一个用于基准测试内存使用和执行速度的脚本。它生成一个图表,可以展示二者之间的关系。它有一个选项可以关闭垃圾回收器...你会看到它如何影响分析...有和没有垃圾回收器的图表差别非常明显:
rebol [
title: "profiling tests with graphics"
author: "Maxim Olivier-Adlhoch"
purpose: "given a few metrics and code blocks, will plot out the time and memory use for each repetition."
]
loops: 2000
repetitions: 500
turn-off-garbage-collector?: false
mem-color: red
time-color: sky
bg-color: black
gfx-size: 600x400
margins: 100x100
lw: 2
label-color: white * .85
border-color: gray * 0.5
slices: 10
plot-data: []
platform: does [
select [
1 AMIGA
2 OSX
3 WIN32
4 LINUX
] system/version/4
]
either ( platform = 'WIN32 ) [
either exists? %libs/windows-chrono.r [
do %libs/windows-chrono.r
][
ask "download and save windows-chrono from rebol.org ? ^/^/ * press ENTER to confirm^/ * press ESCAPE to halt."
make-dir %libs/
write %libs/windows-chrono.r read http://www.rebol.org/download-a-script.r?script-name=windows-chrono.r
print "windows chrono downloaded"
]
][
time-lapse: :delta-time
]
blk: make block! repetitions
print "===================="
print "running tests"
if turn-off-garbage-collector? [
recycle/off
]
repeat i repetitions [
tmp: last append/only blk copy []
time: time-lapse [
loop loops [
append tmp make string! 1000
]
]
memory: stats
append plot-data reduce [ time memory]
prin "."
]
time-x: 0:00
stat-y: 0
foreach [time stat] plot-data [
time-x: max time-x time
stat-y: max stat-y stat
]
time-scale: (gfx-size/y / to-decimal time-x )
mem-scale: gfx-size/y / stat-y
print ""
?? time-scale
?? mem-scale
i: 0
mem-line: compose [line-width lw pen (mem-color ) line () ]
time-line: compose [line-width lw pen (time-color ) line () ]
foreach [time ram] plot-data [
time: to-decimal time
append mem-line margins + to-pair reduce [ x: to-integer (i / (repetitions - 1) * gfx-size/x) to-integer ( ram * mem-scale )]
append time-line margins + to-pair reduce [ x to-integer ( time * time-scale )]
i: i + 1
]
scale-drw: compose [
line-width 1
pen (border-color) box (margins) (margins + gfx-size)
]
repeat i (slices + 1) [
ii: i - 1
append scale-drw reduce [
'pen mem-color
'text margins + to-pair reduce [ -50 (gfx-size/y - (ii / slices * gfx-size/y ) ) - 5 ]
rejoin [ to-string round/to (ii / slices * stat-y / 1'000'000) 0.01 " MB" ]
'pen time-color
'text margins + to-pair reduce [ gfx-size/x (gfx-size/y - (ii / slices * gfx-size/y ) ) - 5 ]
rejoin [ to-string round/to (1000 * ii / slices * to-decimal time-x) 0.1 "ms" ]
'pen border-color
'text margins + to-pair reduce [ ((ii / slices * gfx-size/x ) ) gfx-size/y + 10 ]
rejoin [ to-string to-integer( ii / slices * repetitions) ]
]
]
view layout compose/deep [
box (margins * 2 + gfx-size) bg-color effect [draw [
translate (0x1 * (margins * 2 + gfx-size)) scale 1 -1.0 (mem-line) (time-line)
reset-matrix
(scale-drw)
]]
]
随意复制和编辑此脚本,它是一个非常简单的情节机制... 我相信你可以添加额外的曲线(比如测试函数输出值的曲线)。
在此脚本的顶部,您可以看到有一个选项来禁用GC... 在这个测试代码中,在循环中我们只分配RAM,以查看GC对整体性能的影响。
这是启用GC的运行结果:
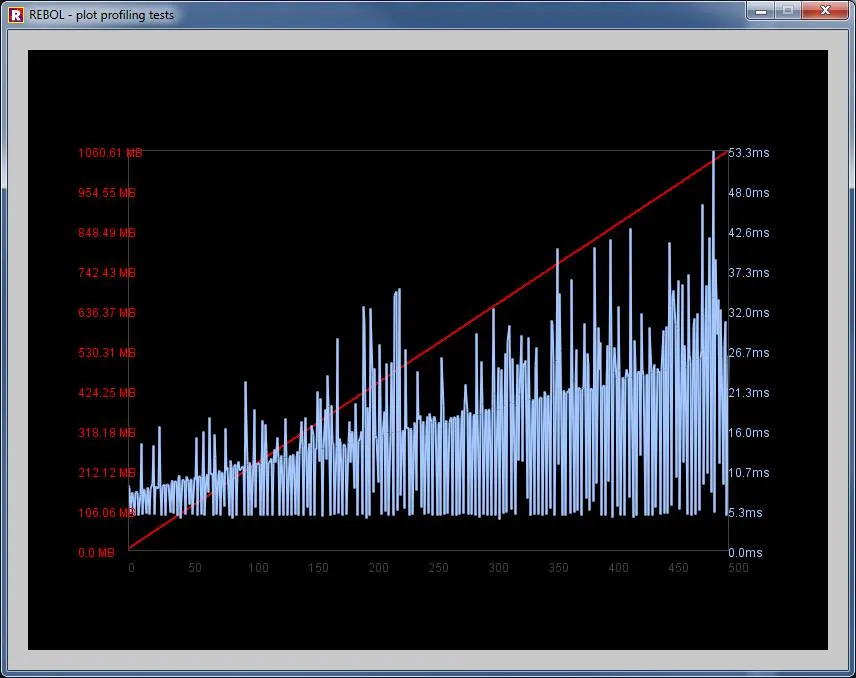
您可以看到执行受到干扰,因为GC不断监视和中断进程。
随着RAM的增加(红线),执行不断减慢。请注意,所有块都是预先分配的,因此这并不是由于内部内存复制引起的。
这是禁用GC的运行结果:
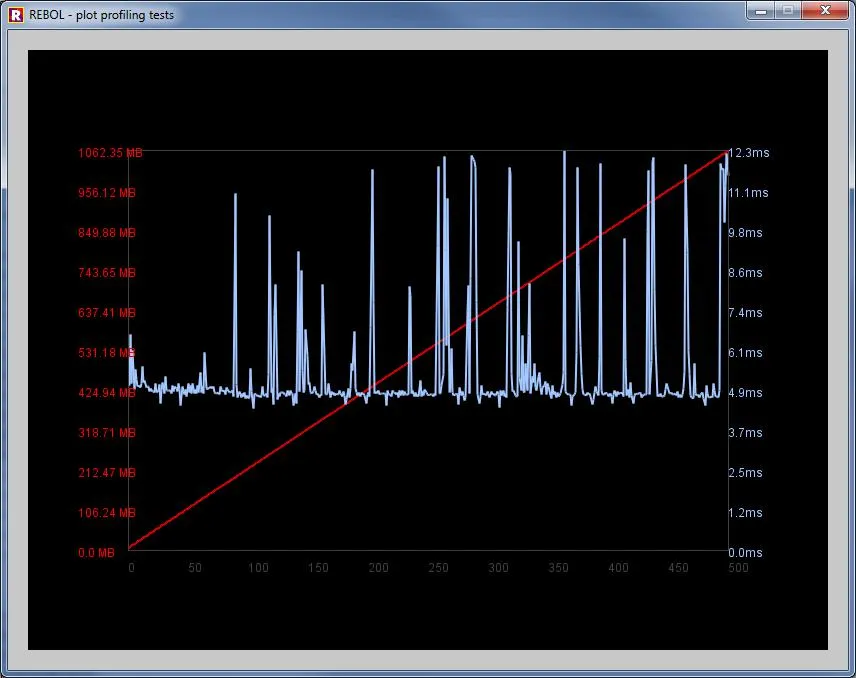
您可以清楚地看到操作的线性程度。
您在两次运行中看到的不规则跳跃是正常的操作系统多任务处理造成的。
请注意,在两个测试中的最佳速度是相同的。大约5毫秒...但平均值却越来越糟糕。
出于这个原因,每当我测试任何代码时,我总是关闭GC,除非代码生成的立即内存迅速将任务耗尽。或者,您可以在代码的关键点上进行回收/关闭回收以减轻此问题的影响。当调用回收/开启时,如果超过其阈值,它将立即进行清理。
请注意,内存分配复杂性会对GC产生影响。不仅是RAM的数量,而且构建的值的数量也会产生重大影响。使用上面的分析器,您可以构建指数级缓慢的算法,在仅有300MB时就变得几乎无法使用,而它们一开始就是实时的。
绑定和创建许多复杂对象是完全破坏rebol速度的一个方面。如果您要创建大型数据集,则最好使用块层次结构而不是对象层次结构。
我希望上述脚本能帮助您分析一些要测试的内容。
forall现在比foreach明显更快,而在R2本地foreach比mezzanineforall快得多。唯一仍然是mezz的循环是一个新的find-all,我们可能也会将其转换为本地化。 - BrianH