我正在使用Matplotlib生成地下水位等值线图。如下所示:
这是我现在有的;我该如何添加像下面图片中的水流箭头呢?
我想添加箭头,使它看起来像这样:
如果有人有一些想法和/或代码示例,那将不胜感激。
这是我现在有的;我该如何添加像下面图片中的水流箭头呢?
我想添加箭头,使它看起来像这样:
如果有人有一些想法和/或代码示例,那将不胜感激。
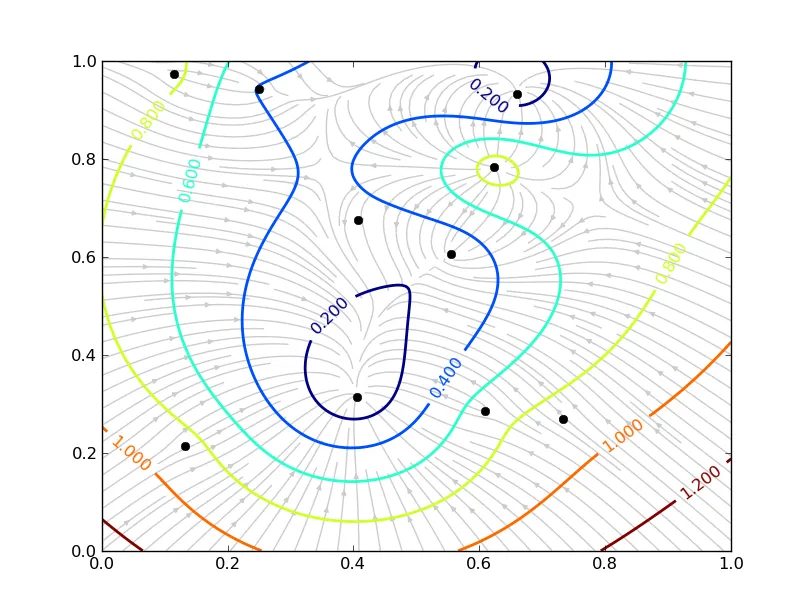
你需要一个最新的(>= 1.2)版本的matplotlib,但streamplot可以解决这个问题。你只需要取负梯度来创建你的水头(对于地表含水层也称为“水位线”)网格。
以下是从头部随机点观测生成的快速示例:
import numpy as np
from scipy.interpolate import Rbf
import matplotlib.pyplot as plt
# Make data repeatable
np.random.seed(1981)

# Generate some random wells with random head (water table) observations
x, y, z = np.random.random((3, 10))

# Interpolate these onto a regular grid
xi, yi = np.mgrid[0:1:100j, 0:1:100j]
func = Rbf(x, y, z, function='linear')
zi = func(xi, yi)

# -- Plot --------------------------
fig, ax = plt.subplots()

# Plot flowlines
dy, dx = np.gradient(-zi.T) # Flow goes down gradient (thus -zi)
ax.streamplot(xi[:,0], yi[0,:], dx, dy, color='0.8', density=2)

# Contour gridded head observations
contours = ax.contour(xi, yi, zi, linewidths=2)
ax.clabel(contours)

# Plot well locations
ax.plot(x, y, 'ko')

plt.show()
而不是dx,dy`。 - Joe Kington