在R中给文本标签加上背景颜色

16
我想知道是否有一种简单的方法,可以使用基础图形系统在R绘图中添加具有对比背景的文本标签。到目前为止,我一直使用
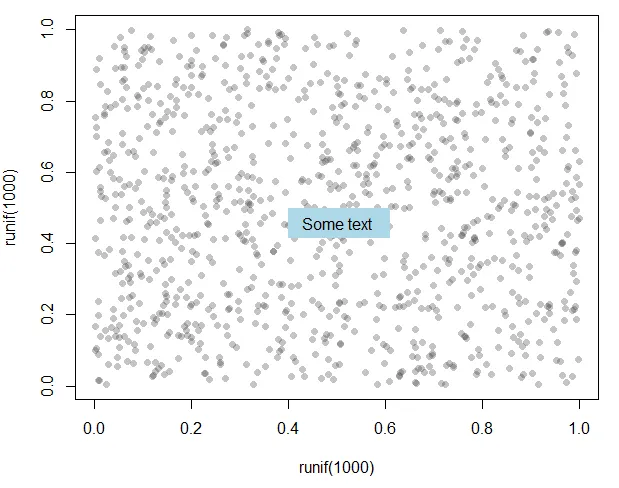
rect()函数与graphics::strheight()graphics::strwidth()分别创建背景框,然后使用text()放置我的文本。
# Prepare a noisy background:
plot(x = runif(1000), y = runif(1000), type = "p", pch = 16, col = "#40404050")

## Parameters for my text:
myText <- "some Text"
posCoordsVec <- c(0.5, 0.5)
cex <- 2

## Background rectangle: 
textHeight <- graphics::strheight(myText, cex = cex)
textWidth <- graphics::strwidth(myText, cex = cex)
pad <- textHeight*0.3
rect(xleft = posCoordsVec[1] - textWidth/2 - pad, 
        ybottom = posCoordsVec[2] - textHeight/2 - pad, 
        xright = posCoordsVec[1] + textWidth/2 + pad, 
        ytop = posCoordsVec[2] + textHeight/2 + pad,
        col = "lightblue", border = NA)

## Place text:
text(posCoordsVec[1], posCoordsVec[2], myText, cex = cex)

这是结果:

带背景的文本

这个方法可以完成任务,但是当你开始使用posadjoffset等调整文本位置时,就会遇到麻烦。我知道TeachingDemos::shadowtext()可以让文本从背景中显现出来,但这只添加了一个轮廓而不是一个框。

我在寻找一种简单的方法来创建带有背景框的文本,类似于text(x, y, labels, bg = "grey20")。我不能是第一个需要这样的功能的人,我可能只是漏掉了一些明显的东西。感谢您的帮助。谢谢!

4个回答

17

基本图形

使用 legend

plot(x = runif(1000), y = runif(1000), type = "p", pch = 16, col = "#40404050")
legend(0.4, 0.5, "Some text", box.col = "lightblue", bg = "lightblue", adj = 0.2)

输出:

enter image description here ggplot2

使用geom_label

library(ggplot2)
df <- data.frame(x = runif(1000), y = runif(1000))
ggplot(data = df, aes(x = x , y = y))+ 
  geom_point(alpha = 0.2)+
  geom_label(aes(x = 0.5, y = 0.5, label = "Some text"), 
             fill = "lightblue", label.size = NA, size = 5)

输出: 在此输入图片描述


谢谢,ggplot似乎提供了合适的工具。不过我正在寻找一个使用基本图形系统的解决方案。 - ikop
@ikop 我另外提供了一种解决方案,使用基本图形系统中的图例。 - mpalanco
1
@jay.sf 是的,可以使用参数cex,例如:cex = 0.5。 - mpalanco
您也可以提供 box.col = NA 来关闭框边界。 - MichaelChirico
这对于legend函数有效,但对于text()函数和其他使用它的函数(例如thigmophobe.labels())无效。 - Tomas
显示剩余2条评论

11

看起来似乎没有简单的解决方案。因此,我编写了自己的函数来完成这项工作:

#' Add text with background box to a plot
#'
#' \code{boxtext} places a text given in the vector \code{labels} 
#' onto a plot in the base graphics system and places a coloured box behind 
#' it to make it stand out from the background.
#' 
#' @param x numeric vector of x-coordinates where the text labels should be 
#' written. If the length of \code{x} and \code{y} differs, the shorter one 
#' is recycled.
#' @param y numeric vector of y-coordinates where the text labels should be 
#' written. 
#' @param labels a character vector specifying the text to be written.
#' @param col.text the colour of the text 
#' @param col.bg color(s) to fill or shade the rectangle(s) with. The default 
#' \code{NA} means do not fill, i.e., draw transparent rectangles.
#' @param border.bg color(s) for rectangle border(s). The default \code{NA}
#' omits borders. 
#' @param adj one or two values in [0, 1] which specify the x (and optionally 
#' y) adjustment of the labels. 
#' @param pos a position specifier for the text. If specified this overrides 
#' any adj value given. Values of 1, 2, 3 and 4, respectively indicate 
#' positions below, to the left of, above and to the right of the specified 
#' coordinates.
#' @param offset when \code{pos} is specified, this value gives the offset of 
#' the label from the specified coordinate in fractions of a character width.
#' @param padding factor used for the padding of the box around 
#' the text. Padding is specified in fractions of a character width. If a 
#' vector of length two is specified then different factors are used for the
#' padding in x- and y-direction.    
#' @param cex numeric character expansion factor; multiplied by 
#' code{par("cex")} yields the final character size. 
#' @param font the font to be used
#'
#' @return Returns the coordinates of the background rectangle(s). If 
#' multiple labels are placed in a vactor then the coordinates are returned
#' as a matrix with columns corresponding to xleft, xright, ybottom, ytop. 
#' If just one label is placed, the coordinates are returned as a vector.
#' @author Ian Kopacka
#' @examples
#' ## Create noisy background
#' plot(x = runif(1000), y = runif(1000), type = "p", pch = 16, 
#' col = "#40404060")
#' boxtext(x = 0.5, y = 0.5, labels = "some Text", col.bg = "#b2f4f480", 
#'     pos = 4, font = 2, cex = 1.3, padding = 1)
#' @export
boxtext <- function(x, y, labels = NA, col.text = NULL, col.bg = NA, 
        border.bg = NA, adj = NULL, pos = NULL, offset = 0.5, 
        padding = c(0.5, 0.5), cex = 1, font = graphics::par('font')){

    ## The Character expansion factro to be used:
    theCex <- graphics::par('cex')*cex

    ## Is y provided:
    if (missing(y)) y <- x

    ## Recycle coords if necessary:    
    if (length(x) != length(y)){
        lx <- length(x)
        ly <- length(y)
        if (lx > ly){
            y <- rep(y, ceiling(lx/ly))[1:lx]           
        } else {
            x <- rep(x, ceiling(ly/lx))[1:ly]
        }       
    }

    ## Width and height of text
    textHeight <- graphics::strheight(labels, cex = theCex, font = font)
    textWidth <- graphics::strwidth(labels, cex = theCex, font = font)

    ## Width of one character:
    charWidth <- graphics::strwidth("e", cex = theCex, font = font)

    ## Is 'adj' of length 1 or 2?
    if (!is.null(adj)){
        if (length(adj == 1)){
            adj <- c(adj[1], 0.5)            
        }        
    } else {
        adj <- c(0.5, 0.5)
    }

    ## Is 'pos' specified?
    if (!is.null(pos)){
        if (pos == 1){
            adj <- c(0.5, 1)
            offsetVec <- c(0, -offset*charWidth)
        } else if (pos == 2){
            adj <- c(1, 0.5)
            offsetVec <- c(-offset*charWidth, 0)
        } else if (pos == 3){
            adj <- c(0.5, 0)
            offsetVec <- c(0, offset*charWidth)
        } else if (pos == 4){
            adj <- c(0, 0.5)
            offsetVec <- c(offset*charWidth, 0)
        } else {
            stop('Invalid argument pos')
        }       
    } else {
      offsetVec <- c(0, 0)
    }

    ## Padding for boxes:
    if (length(padding) == 1){
        padding <- c(padding[1], padding[1])
    }

    ## Midpoints for text:
    xMid <- x + (-adj[1] + 1/2)*textWidth + offsetVec[1]
    yMid <- y + (-adj[2] + 1/2)*textHeight + offsetVec[2]

    ## Draw rectangles:
    rectWidth <- textWidth + 2*padding[1]*charWidth
    rectHeight <- textHeight + 2*padding[2]*charWidth    
    graphics::rect(xleft = xMid - rectWidth/2, 
            ybottom = yMid - rectHeight/2, 
            xright = xMid + rectWidth/2, 
            ytop = yMid + rectHeight/2,
            col = col.bg, border = border.bg)

    ## Place the text:
    graphics::text(xMid, yMid, labels, col = col.text, cex = theCex, font = font, 
            adj = c(0.5, 0.5))    

    ## Return value:
    if (length(xMid) == 1){
        invisible(c(xMid - rectWidth/2, xMid + rectWidth/2, yMid - rectHeight/2,
                        yMid + rectHeight/2))
    } else {
        invisible(cbind(xMid - rectWidth/2, xMid + rectWidth/2, yMid - rectHeight/2,
                        yMid + rectHeight/2))
    }    
}

这个函数允许我添加文本到绘图中并带有背景框,同时保留了大部分text()函数的灵活性。

例如:

## Create noisy background:
plot(x = runif(1000), y = runif(1000), type = "p", pch = 16, col = "#40404060")
## Vector of labels, using argument 'pos' to position right of coordinates:
boxtext(x = c(0.3, 0.1), y = c(0.6, 0.1), labels = c("some Text", "something else"), 
        col.bg = "#b2f4f4c0", pos = 4, padding = 0.3)
## Tweak cex, font and adj:
boxtext(x = 0.2, y = 0.4, labels = "some big and bold text", 
        col.bg = "#b2f4f4c0", adj = c(0, 0.6), font = 2, cex = 1.8)

text with background using boxtext


1
plot( c(1,20), c(-0.2,0.2)); boxtext(10, -0.03, "text2", col.bg="cyan", border.bg="red") 上失败了;y轴框太高了。 - ivo Welch

7

祝你们辛勤的工作取得成功,但是plotrixboxed.labels()

# Prepare a noisy background:
plot(x = runif(1000), y = runif(1000), type = "p", pch = 16, col = "#40404050")

## Parameters for my text:
myText <- "some Text"
posCoordsVec <- c(0.5, 0.5)
cex <- 2

## Background rectangle: 
textHeight <- graphics::strheight(myText, cex = cex)
textWidth <- graphics::strwidth(myText, cex = cex)
pad <- textHeight*0.3


## Place text:
plotrix::boxed.labels(posCoordsVec[1], posCoordsVec[2], myText, cex = cex, 
      border = NA, bg ="lightblue", xpad = 1.4, ypad = 1.4)

boxed.labels example


1
非常简单!在我看来,这是迄今为止最好的解决方案。 - Ankerstjerne

5

使用AltCode字符来快速制作一个框的小技巧:

plot(x=runif(1000), y=runif(1000), 
     type="p", pch=16, col="#40404050")

labels <- c("some text", "something else")

boxes <- sapply(nchar(labels), function(n) 
  paste(rep("\U2588", n), collapse=""))

pos <- rbind(c(0.2, .1), c(.5, .5))
text(pos, labels=boxes, col="#CCCCCC99")
text(pos, labels=labels, family = "mono")

3
不错的技巧,不过最好使用Unicode。尝试使用paste(rep("\U2588", n), collapse="") - jay.sf
1
只为单间距字体,不包含换行的情况 - ivo Welch
这是唯一对我有效的解决方案!谢谢!我根据之前的评论建议更新了答案,因为这些对其正常工作至关重要。 - Tomas
当然,只有少数字体才具有U2588字符。否则,这些都是未填充的方框,让背景内容透过来。 - undefined

网页内容由stack overflow 提供, 点击上面的
可以查看英文原文,
原文链接