我刚开始学习KnitR以及使用Markdown来生成R文档和报告。这看起来非常适合我在工作中需要完成的很多日常报告。然而,我没有找到一种简单的方法来使用Markdown格式打印数据框和表格(类似于xtable,但是使用Markdown而不是LaTeX或HTML)。我知道我可以嵌入xtable的HTML输出,但我想知道是否有基于Markdown的解决方案?
8个回答
125
现在
knitr(自1.3版本以来)包括了kable函数,可以用于创建表格:> library(knitr)
> kable(head(iris[,1:3]), format = "markdown")
| Sepal.Length| Sepal.Width| Petal.Length|
|-------------:|------------:|-------------:|
| 5,1| 3,5| 1,4|
| 4,9| 3,0| 1,4|
| 4,7| 3,2| 1,3|
| 4,6| 3,1| 1,5|
| 5,0| 3,6| 1,4|
| 5,4| 3,9| 1,7|
更新:如果您在文档中获得了原始的Markdown,请尝试设置results = "asis"代码块选项。
- Artem Klevtsov
7
26在knitr内运行时,您可以省略
format参数,因为knitr知道输出格式并将自动设置它。 - Yihui Xie4@Yihui 你很棒。 - isomorphismes
3我尝试了一下,但是 ```{r} kable(...) 只显示了原始的 markdown。 - Alex Brown
7尝试将本地块选项设置为
results = asis。 - Artem Klevtsov6FYI,现在的knitr命令需要采用
results='asis'的格式。 - Stedy显示剩余2条评论
32
可以完成此任务的两个软件包是pander
library(devtools)
install_github('pander', 'Rapporter')
或者ascii
pander是一种略有不同的报告构建方法,(但对于此功能可能很有用)。
ascii 将允许您使用 type = 'pandoc'(或其他各种markdown风格)打印。
library(ascii)
print(ascii(head(iris[,1:3])), type = 'pandoc')


    **Sepal.Length**   **Sepal.Width**   **Petal.Length**
--- ------------------ ----------------- ------------------
1   5.10               3.50              1.40
2   4.90               3.00              1.40
3   4.70               3.20              1.30
4   4.60               3.10              1.50
5   5.00               3.60              1.40
6   5.40               3.90              1.70
--- ------------------ ----------------- ------------------
pandoc将Markdown转换为所需文档类型的,但是使用style='rmarkdown'将创建与此markdown包和rstudio中内置的转换兼容的表格。- mnel
2
3关于
pander的说明:它不仅可以生成其他类型的表格,还可以生成rmarkdown样式的表格,例如:pander(head(iris[,1:3]), style = 'rmarkdown')。 - daroczig@daroczig -- 感谢您的回复,我已经注意到了。 - mnel
26
我想更新一下我的做法。目前我正在使用hwriter包来打印表格,并使用row.*和col.*功能将CSS类放在不同的元素上。然后,我编写了自定义的CSS使我的显示效果符合我的要求。因此,这里有一个示例,以防其他人也遇到类似的问题。
首先,创建一个文件来进行knitting并将Markdown转换为HTML:
FILE: file_knit.r
#!/usr/bin/env Rscript

library(knitr)
library(markdown)

knit("file.Rmd")
markdownToHTML("file.md","file.html",stylesheet="~/custom.css")
接下来,创建实际的 Markdown 文件:
FILE: file.Rmd
Report of Fruit vs. Animal Choices
==================================

This is a report of fruit vs. animal choices.

```{r echo=FALSE,results='asis'}
library(hwriter)
set.seed(9850104)
my.df <- data.frame(Var1=sample(x=c("Apple","Orange","Banana"),size=40,replace=TRUE),
                    Var2=sample(x=c("Dog","Cat","Bunny"),size=40,replace=TRUE))

tbl1 <- table(my.df$Var1,my.df$Var2)

tbl1 <- cbind(tbl1,rowSums(tbl1))
tbl1 <- rbind(tbl1,colSums(tbl1))

colnames(tbl1)[4] <- "TOTAL"
rownames(tbl1)[4] <- "TOTAL"

# Because I used results='asis' for this chunk, I can just use cat() and hwrite() to
# write out the table in HTML. Using hwrite()'s row.* function, I can assign classes
# to the various table elements.
cat(hwrite(tbl1,
           border=NA,
           table.class="t1",
           row.class=list(c("header col_first","header col","header col","header col", "header col_last"),
                          c("col_first","col","col","col","col_last"),
                          c("col_first","col","col","col","col_last"),
                          c("col_first","col","col","col","col_last"),
                          c("footer col_first","footer col","footer col","footer col","footer col_last"))))
```
最后,只需创建一个自定义的CSS文件。
FILE: custom.css
body {
  font-family: sans-serif;
  background-color: white;
  font-size: 12px;
  margin: 20px;
}

h1 {font-size:1.5em;}

table {
  border: solid;
  border-color: black;
  border-width: 2px;
  border-collapse: collapse;
  margin-bottom: 20px;
  text-align: center;
  padding: 0px;
}

.t1 .header {
  color: white;
  background-color: black;
  border-bottom: solid;
  border-color: black;
  border-width: 2px;
  font-weight: bold;
}

.t1 .footer {
  border-top: solid;
  border-color: black;
  border-width: 2px;
}

.t1 .col_first {
  border-right: solid;
  border-color: black;
  border-width: 2px;
  text-align: left;
  font-weight: bold;
  width: 75px;
}

.t1 .col {
  width: 50px;
}

.t1 .col_last {
  width: 50px;
  border-left: solid;
  border-color: black;
  border-width: 2px;
}
执行./file_knit.r后生成了file.html文件,并且其外观如下所示:
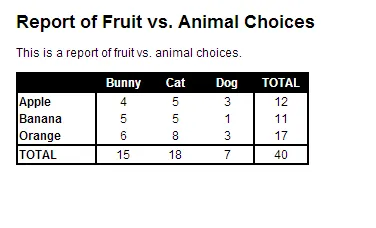
因此,希望这对于其他想在Markdown输出中获得更多格式的人有所帮助!
- TARehman
7
1是的,不行。可以使用Markdown转换为HTML,但无法转换为PDF、DOCX等格式。问题是关于使用Markdown的一般性,而不仅仅是用它来创建HTML文件 - 这可能是你的意图,但没有写下来。 - petermeissner
你有没有注意到我在回答自己的问题?如果你认为这样会有帮助,我可以编辑问题或者给它打上不同的标签。 - TARehman
jip,改变问题会有所帮助...但为什么要让它更具体,当它更广泛和普遍时对所有人都更有用呢?关于你回答自己的问题,其他人提供Markdown格式的表格,而你提供HTML格式的表格-这并不是错的,但我发现其他答案更加简洁、优雅和有帮助。并不是每个人都必须喜欢你的答案,难道有人喜欢你的答案就不够了吗? - petermeissner
7你曾经说过我的回答并没有错,但是其他人的回答更好。正确使用投票系统应该是给更好的回答点赞而不是给我的回答点踩。参考这里:http://stackoverflow.com/help/privileges/vote-down,“当你遇到一个极其懒惰、没有付出努力的帖子或者一个明显且可能有危险性的错误回答时,请使用你的踩票”。 - TARehman
我们在 R Markdown 文件中包含了 CSS 文件后,应该将它放在哪里? - Moby M
显示剩余2条评论
18
在 pander 包中有函数:
> library(pander)
> pandoc.table(head(iris)[, 1:3])

-------------------------------------------
 Sepal.Length   Sepal.Width   Petal.Length
-------------- ------------- --------------
     5.1            3.5           1.4

     4.9             3            1.4

     4.7            3.2           1.3

     4.6            3.1           1.5

      5             3.6           1.4

     5.4            3.9           1.7
-------------------------------------------
- Marius
1
4谢谢你推广
pander :) 请注意,您也可以使用通用的 S3 方法来节省一些输入,例如:pander(head(iris)[, 1:3])。 - daroczig13
制作自定义函数并不是很难。下面是一个非常简单的概念验证,用于生成一个 data.frame 的 rmarkdown 表格:
   rmarkdownTable <- function(df){
      cat(paste(names(df), collapse = "|"))
      cat("\n")
      cat(paste(rep("-", ncol(df)), collapse = "|"))
      cat("\n")

      for(i in 1:nrow(df)){
        cat(paste(df[i,], collapse = "|"))
        cat("\n")
        }
    invisible(NULL)
    }
results = 'asis'的函数:```{r, results = 'asis'}
rmarkdownTable <- function(df){
cat(paste(names(df), collapse = "|"))
cat("\n")
cat(paste(rep("-", ncol(df)), collapse = "|"))
cat("\n")
for(i in 1:nrow(df)){
cat(paste(df[i,], collapse = "|"))
cat("\n")
}
invisible(NULL)
}
rmarkdownTable(head(iris))
```
上面的代码会生成以下图形(在这个例子中,是pdf输出,但由于表格在markdown中,您也可以将其编织成html或word)。
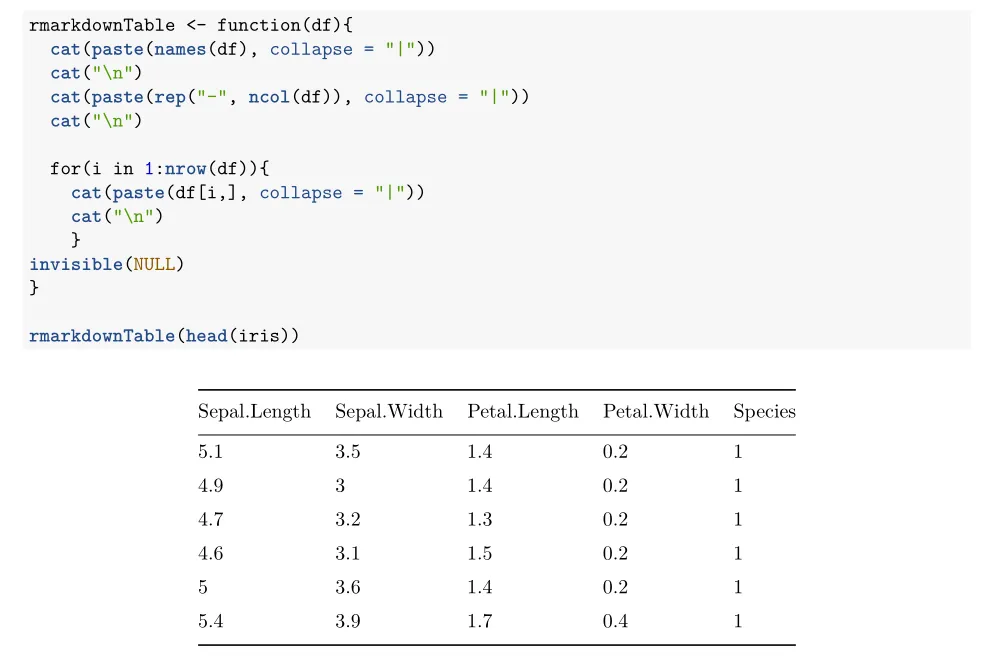 从这里 - 并阅读其他人的代码 - 您可以找出如何操作文本以生成您想要的表格,并创建更多个性化的函数。
- Carlos Cinelli
1
1这很棒,但你知道怎么让它左对齐而不是居中吗? - Patrick
3
在您的Markdown文档中使用knitr::kable和xtable的组合。
library("knitr","xtable")
对于一个简单的数据框 -
kable(head(mtcars[,1:4]),format="markdown")
kable(head(mtcars[,1:4]),format="pandoc",caption="Title of the table")
format="pandoc" 允许使用更多选项,例如标题。
现在是 模型摘要 的组合。
data(tli)
fm1 <- aov(tlimth ~ sex + ethnicty + grade + disadvg, data=tli)
kable(xtable(fm1), caption = "Annova table")
如果需要更多的选项,请考虑使用stargazer包,而不是xtable。
- Pankil Shah
1
要在R中编写/创建Markdown表格,您还可以使用MarkdownReports'
MarkDown_Table_writer_DF_RowColNames()或MarkDown_Table_writer_NamedVector()函数。您只需传递带有维度名称的数据框/矩阵或具有名称的向量,它会解析并以Markdown格式输出表格。- bud.dugong
0
我的Gitlab函数:
to_markdown<-function(df) {
    wrap<-function(x,sep=" ") paste0("|", sep, paste(x, collapse=paste0(sep,"|",sep)), sep, "|", sep=sep)
    paste0(wrap(colnames(df)),
    "\n",
    wrap(rep("------", ncol(df)),sep=""),
    "\n",
    paste(apply(df, 1, wrap), collapse="\n"))
}

cat(to_markdown(head(iris[,1:3])))
| Sepal.Length | Sepal.Width | Petal.Length |
|------|------|------|
| 5.1 | 3.5 | 1.4 |
| 4.9 | 3 | 1.4 |
| 4.7 | 3.2 | 1.3 |
| 4.6 | 3.1 | 1.5 |
| 5 | 3.6 | 1.4 |
| 5.4 | 3.9 | 1.7 |
- Valentas
网页内容由stack overflow 提供, 点击上面的可以查看英文原文,
原文链接
原文链接
print(xtable(data), type = "html")将html代码打印出来。 - user974514knitr兼容的表格解决方案,因此我向pander发送了一个拉取请求以添加表格样式。在未来版本的pander中,您应该能够使用pandoc.table(iris, style="rmarkdown")命令。 - Mariuspander应该已经上线了CRAN。而pandoc是一个用Haskell编写的程序,可以将各种不同格式之间进行转换,它与R没有任何特定关系。 - Mariuspander,上次我听说它不在CRAN上 - 不是pandoc。我的错。 :) - TARehman