我想知道如何配置Jupyter在R内核中绘制较小的图形。
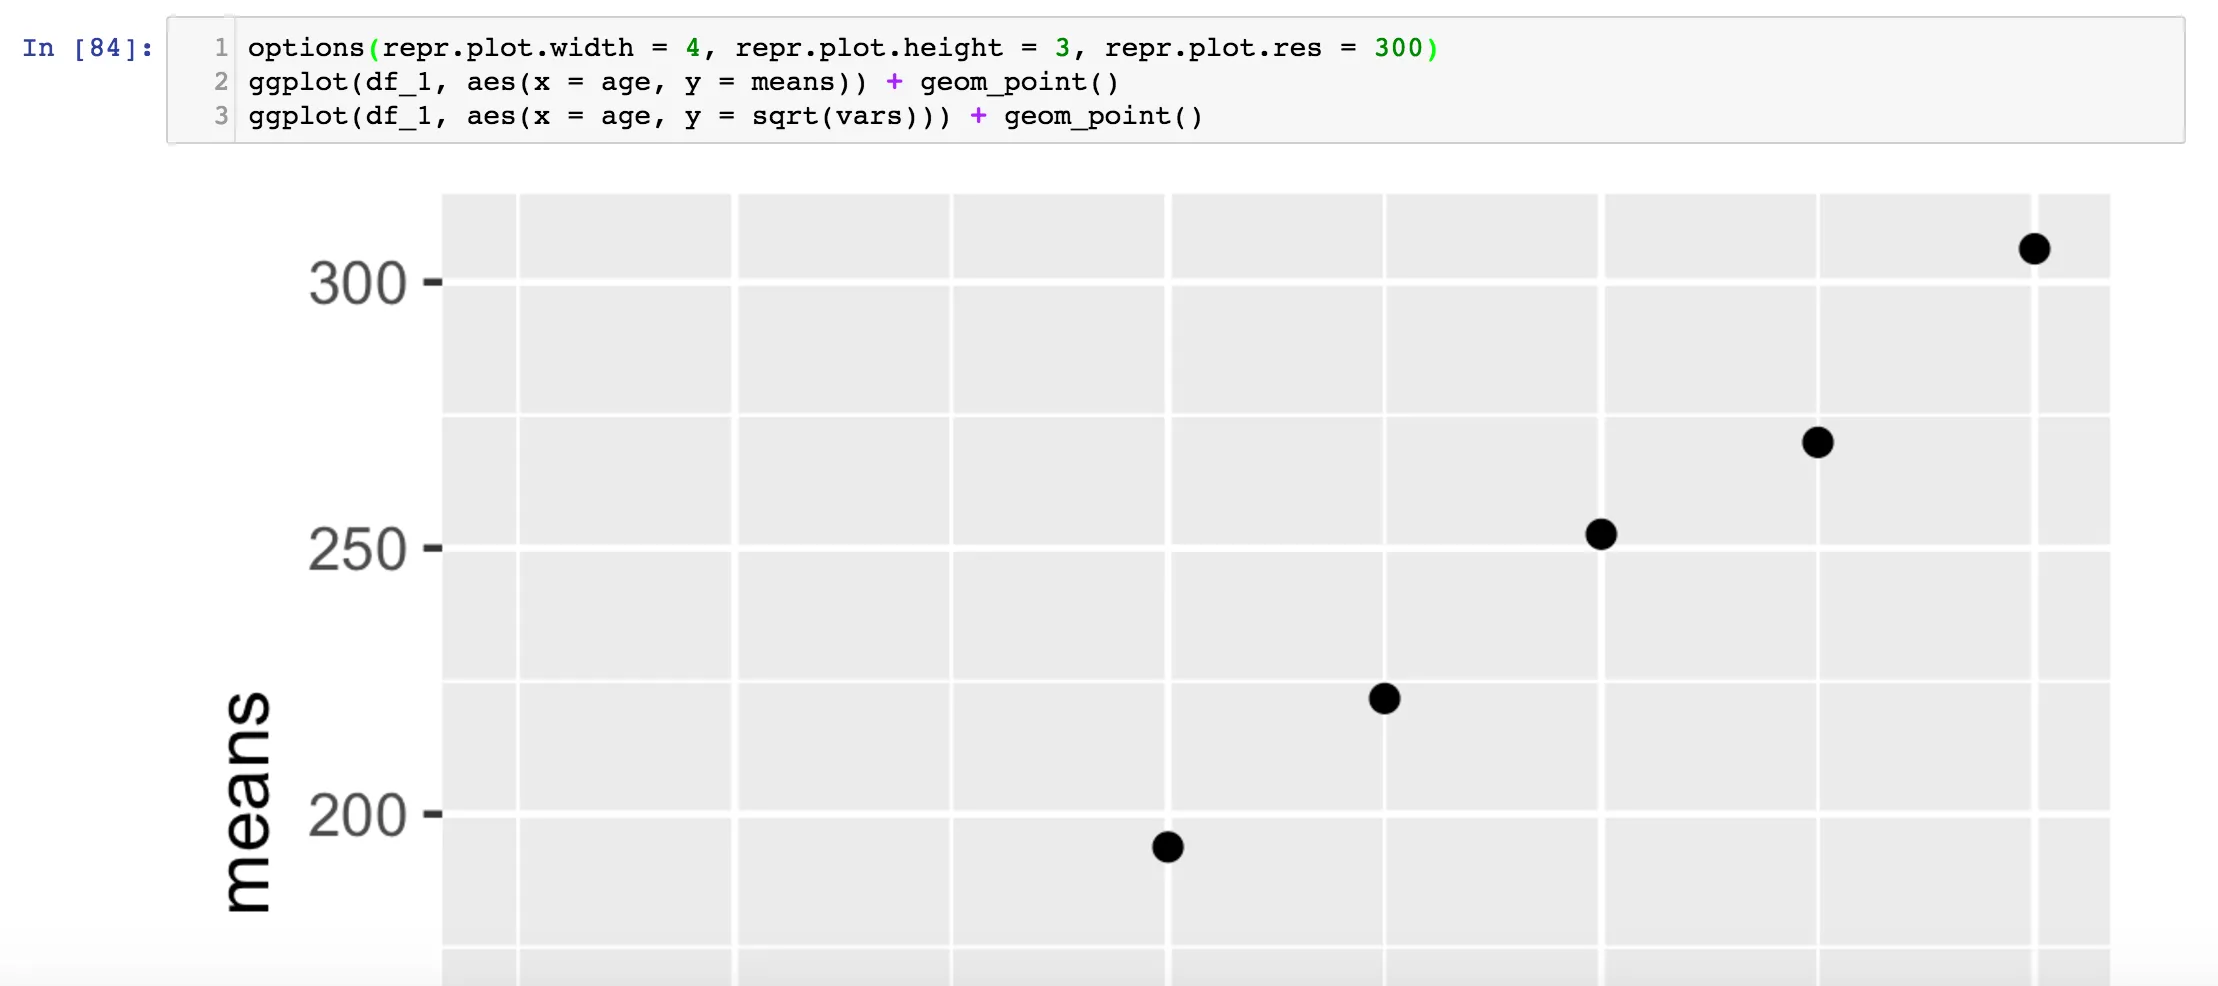
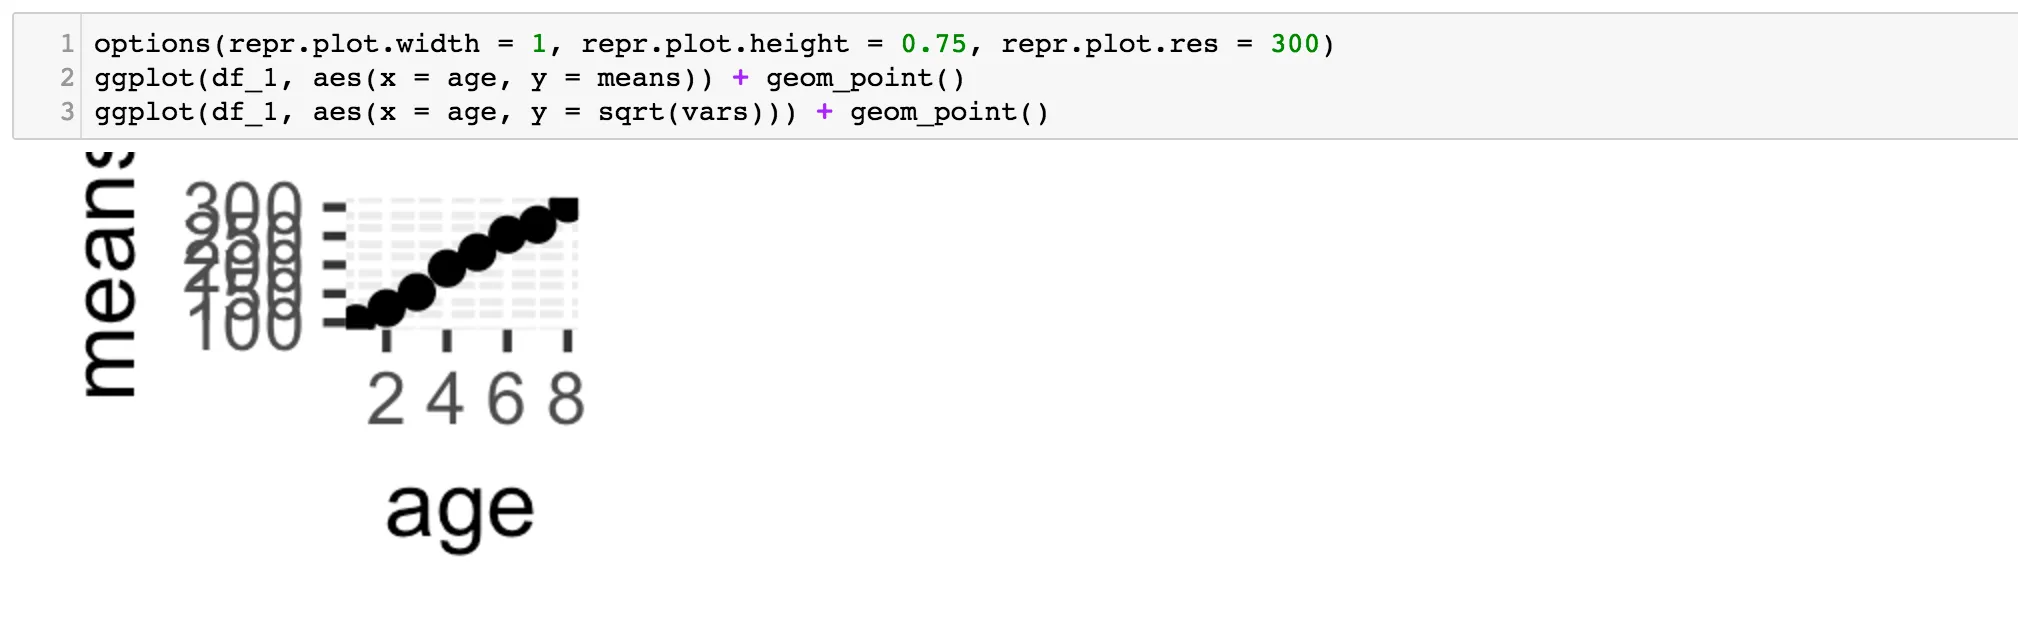
我尝试使用options(repr.plot.width = 1, repr.plot.height = 0.75, repr.plot.res = 300),但结果有些混乱。它会改变R所生成的绘图的大小。有没有直接在Jupyter中配置输出图形大小的方法呢?
换句话说,我如何将第一张图片的大小更改为第二张图片的大小,同时不破坏绘图。
我想知道如何配置Jupyter在R内核中绘制较小的图形。
我尝试使用options(repr.plot.width = 1, repr.plot.height = 0.75, repr.plot.res = 300),但结果有些混乱。它会改变R所生成的绘图的大小。有没有直接在Jupyter中配置输出图形大小的方法呢?
换句话说,我如何将第一张图片的大小更改为第二张图片的大小,同时不破坏绘图。
repr.plot.res = 100
options(repr.plot.width = 1, repr.plot.height = 0.75, repr.plot.res = 100)
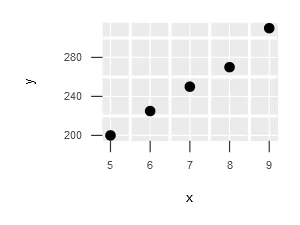
您需要手动设置刻度尺寸、标记大小和文本大小。可以通过theme()函数设置文本大小和刻度尺寸,而通过geom_point()函数设置标记大小。
df_1 = data.frame(x=c(5, 6, 7, 8, 9), y = c(200, 225, 250, 270, 310))

options(repr.plot.width = 1, repr.plot.height = 0.75)
ggplot(df_1, aes(x = x, y = y)) + geom_point(size = 0.3) +
   theme(text = element_text(size = 3), element_line(size = 0.1))
dev.off()也不能恢复,需要重新启动运行时。 - Eduardo Reiswidth或height设置为 1。当使用~1.85或更高版本时,我不会看到“无标题绘图”错误。 - Wayne