我已经准备了一个带有多个matplotlib图形的Jupyter Notebook。现在我想将这些图形保存为PGF格式,以便在LaTeX中重复使用它们。我遵循了这篇博客文章来实现这个想法。
不幸的是,如果我配置matplotlib生成PGF文件,它们就无法显示在Notebook中。如果我禁用matplotlib生成PGF文件,图形就会显示,但是PGF文件不会生成。我该如何同时实现两者呢?
下面是一个最小示例来重现此问题:
# Test if integration between python and latex works fine
import subprocess; subprocess.check_call(["latex", "-help"])

# Configure matplotlib to generate PGF files
import matplotlib
import matplotlib.pyplot as plt
matplotlib.use("pgf")
matplotlib.rcParams.update({
    "pgf.texsystem": "pdflatex",
    'font.family': 'serif',
    'text.usetex': True,
    'pgf.rcfonts': False,
})

# Prepare simple plot
import pandas as pd
df = pd.DataFrame({
     'length': [1.5, 0.5, 1.2, 0.9, 3],
     'width': [0.7, 0.2, 0.15, 0.2, 1.1]
     }, index= ['pig', 'rabbit', 'duck', 'chicken', 'horse'])
hist = df.hist(bins=3)

# Save the plot to PGF file
plt.savefig('histogram.pgf')
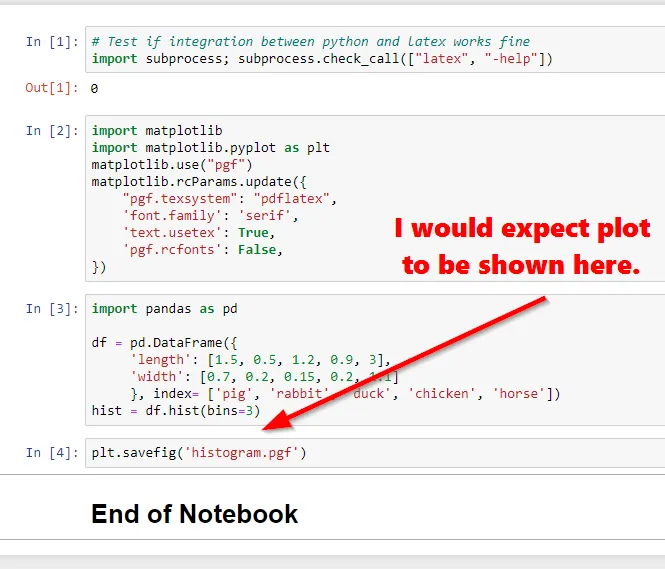
这是启用matplotlib配置的输出结果。生成并保存了
histogram.pgf文件,但图形未显示。
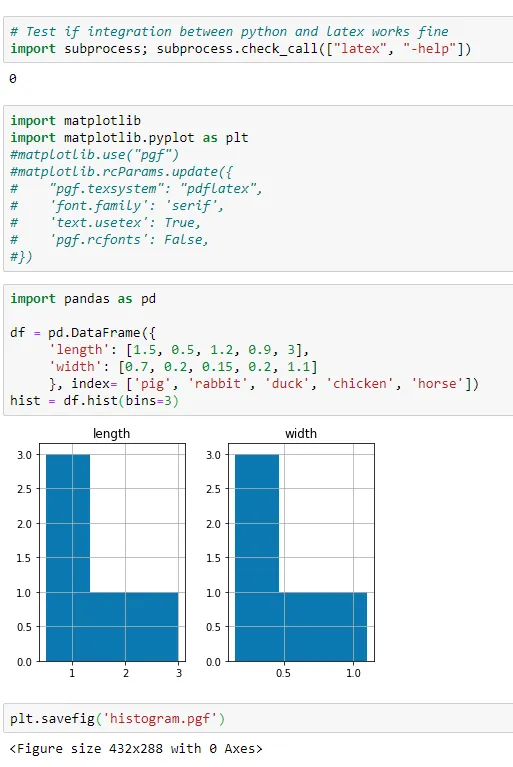
 这是禁用PGF导出的matplotlib配置示例。图形已显示,但生成的
histogram.pgf文件为空---不包含图形。
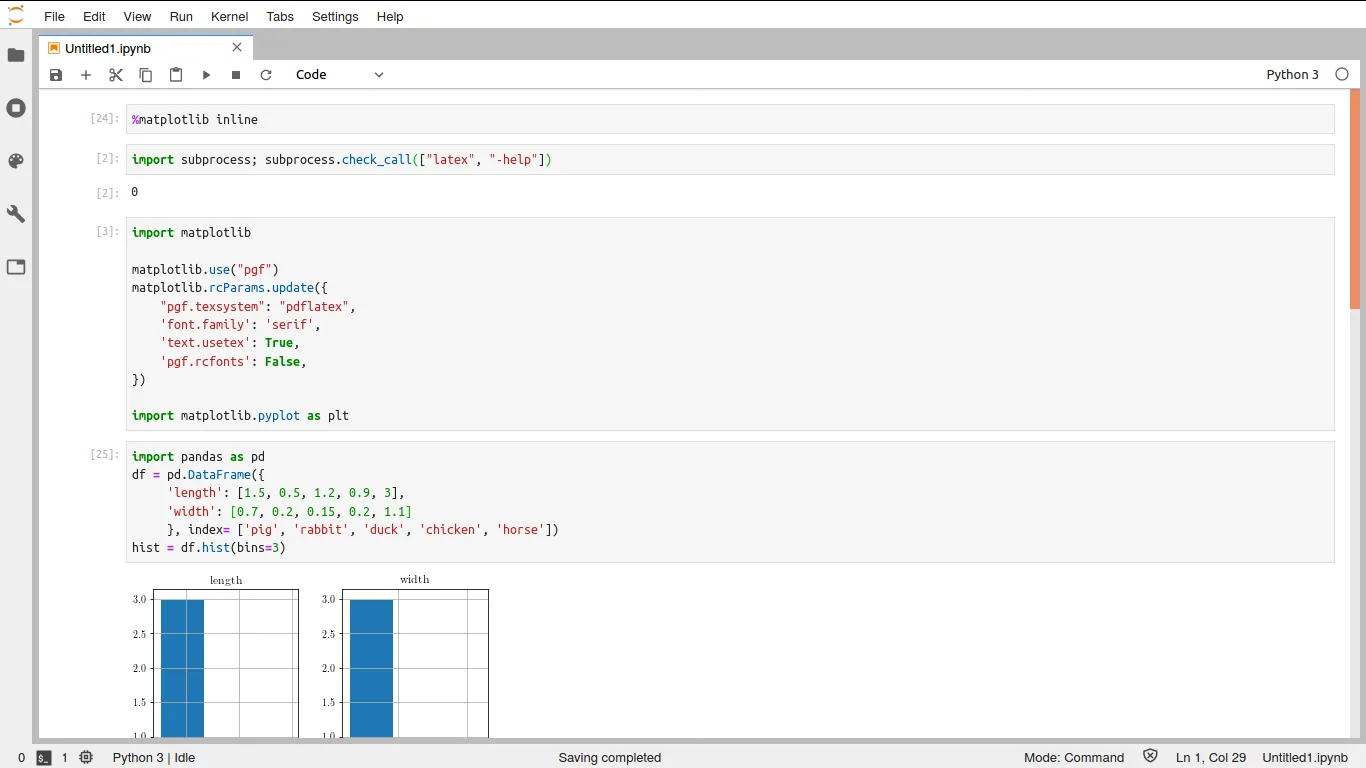
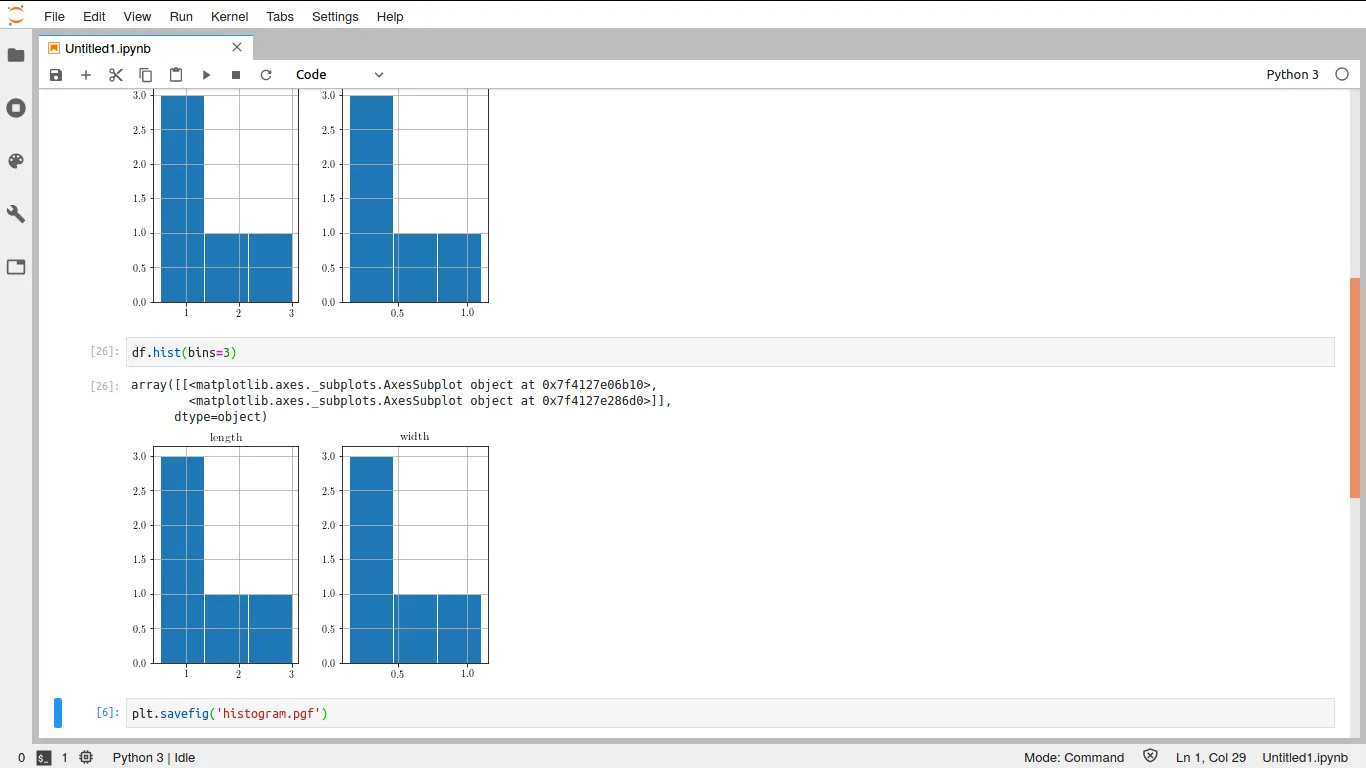
histogram.pgf已经生成,但是在Jupyter Notebook中没有显示出来。我已经添加了一张截图。 - dzieciouplt.something,它默认不会记住以前的 pyplot 状态。因此,无论是否存在pgf问题,要么将plt.savefig放在创建图形的同一单元格中,要么使用fig.savefig,其中fig是要保存的图形。了解这一点后,也许您可以编辑问题以摆脱这个旁枝问题。 - ImportanceOfBeingErnestplt.savefig+ (2) 删除matplotlib.use("pgf")和matplotlib.rcParams.update(...行有所帮助。尽管没有明确告诉 matplotlib 使用 PGF 后端,但图形正确保存到 PGF 文件并在 LaTeX 中正确呈现。 - dzieciou