用Python实现在圆盘中均匀随机分布点的方法

10

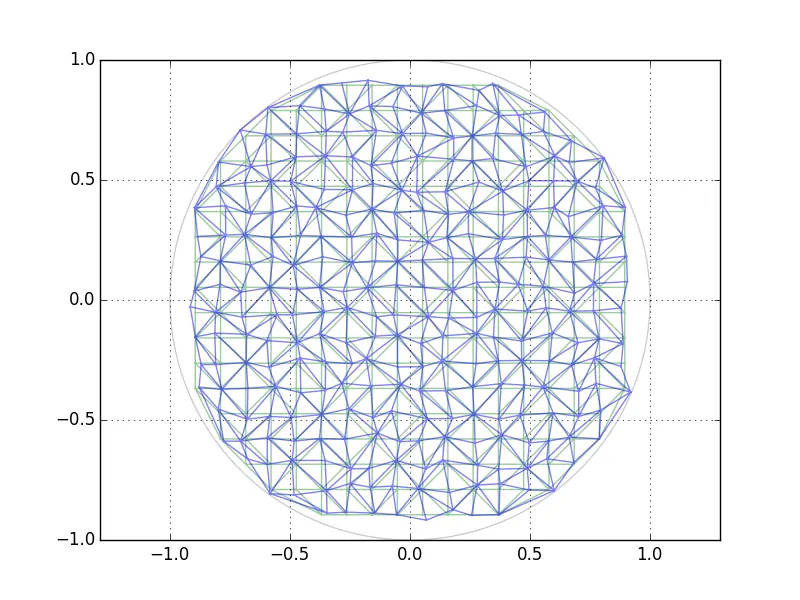
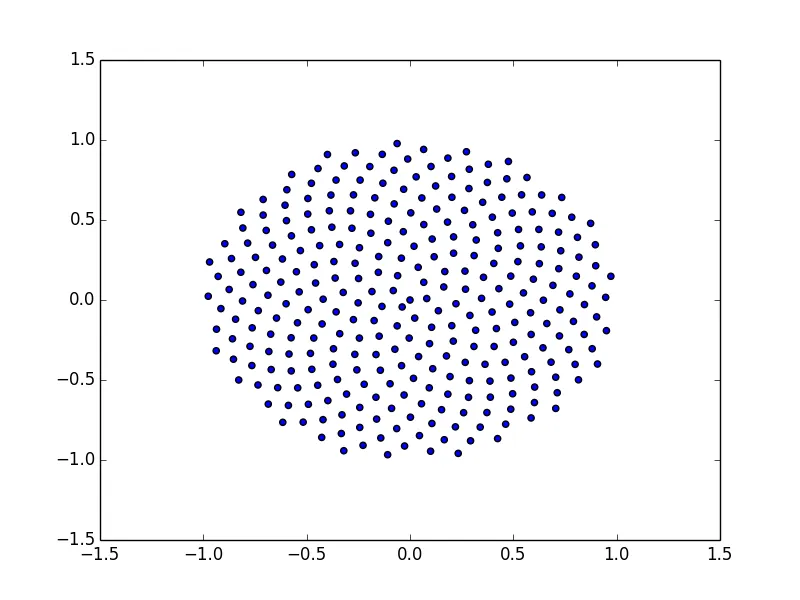
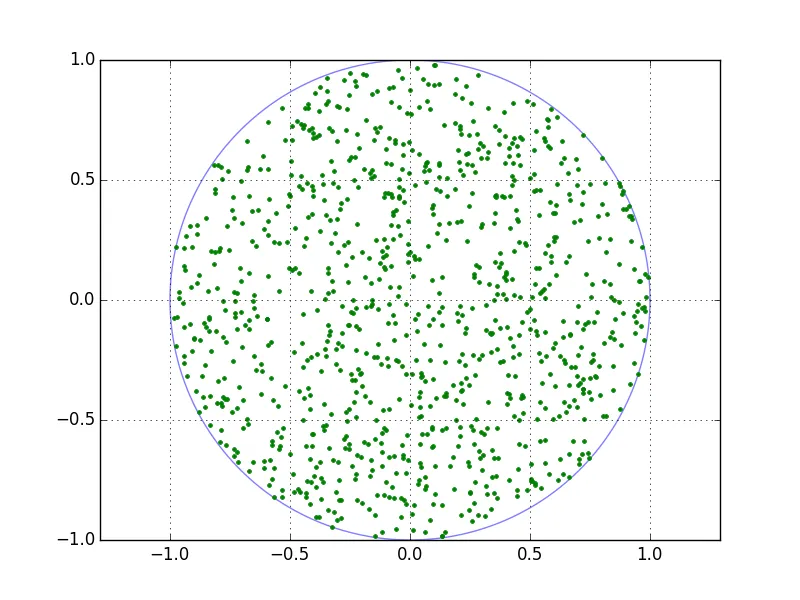
我有一个应用程序,需要在磁盘上以准随机的方式填充'n'个点。我希望这些点有些随机性,但还是要在磁盘上具有相对均匀的密度。

我的目前方法是放置一个点,检查它是否在磁盘内,然后检查它是否与已经保留的所有其他点足够远。我的代码如下:

import os
import random
import math

# ------------------------------------------------ #
# geometric constants
center_x = -1188.2
center_y = -576.9
center_z = -3638.3

disk_distance = 2.0*5465.6
disk_diam = 5465.6

# ------------------------------------------------ #

pts_per_disk = 256
closeness_criteria = 200.0
min_closeness_criteria = disk_diam/closeness_criteria

disk_center = [(center_x-disk_distance),center_y,center_z]
pts_in_disk = []
while len(pts_in_disk) < (pts_per_disk):
    potential_pt_x = disk_center[0]
    potential_pt_dy = random.uniform(-disk_diam/2.0, disk_diam/2.0)
    potential_pt_y = disk_center[1]+potential_pt_dy
    potential_pt_dz = random.uniform(-disk_diam/2.0, disk_diam/2.0)
    potential_pt_z = disk_center[2]+potential_pt_dz
    potential_pt_rad = math.sqrt((potential_pt_dy)**2+(potential_pt_dz)**2)

    if potential_pt_rad < (disk_diam/2.0):
        far_enough_away = True
        for pt in pts_in_disk:
            if math.sqrt((potential_pt_x - pt[0])**2+(potential_pt_y - pt[1])**2+(potential_pt_z - pt[2])**2) > min_closeness_criteria:
                pass
            else:
                far_enough_away = False
                break
        if far_enough_away:
            pts_in_disk.append([potential_pt_x,potential_pt_y,potential_pt_z])

outfile_name = "pt_locs_x_lo_"+str(pts_per_disk)+"_pts.txt"
outfile = open(outfile_name,'w')
for pt in pts_in_disk:
    outfile.write(" ".join([("%.5f" % (pt[0]/1000.0)),("%.5f" % (pt[1]/1000.0)),("%.5f" % (pt[2]/1000.0))])+'\n')
outfile.close()
为了获得最均匀的点密度,我基本上使用另一个脚本迭代地运行此脚本,并逐渐减小“接近度”标准。在某个点上,脚本无法完成,我只使用最后一次成功迭代的点。所以我的问题比较广泛:有没有更好的方法来做到这一点?我的方法目前还可以,但我的直觉告诉我有更好的方法来生成这样的点场。下面绘制了输出的示例,其中一个具有较高的“接近度”标准,另一个具有“找到的最低”接近度标准(我想要的)。

你可以尝试使用SOBOL序列http://en.wikipedia.org/wiki/Sobol_sequence,但你需要将其适应于磁盘/圆。他们甚至有一些用于计算SOBOL序列的Python代码http://people.sc.fsu.edu/~jburkardt/py_src/sobol/sobol.html。 - Camron_Godbout
这是一篇关于这个具体问题的博客文章,提供了一个潜在的解决方案。然而,那个解决方案与你已经在做的事情非常相似:http://mollyrocket.com/casey/stream_0014.html - David Brown
5个回答

9

一种基于MathWorld圆盘随机点选的简单解决方案:

import numpy as np
import matplotlib.pyplot as plt

n = 1000
r = np.random.uniform(low=0, high=1, size=n)  # radius
theta = np.random.uniform(low=0, high=2*np.pi, size=n)  # angle

x = np.sqrt(r) * np.cos(theta)
y = np.sqrt(r) * np.sin(theta)

# for plotting circle line:
a = np.linspace(0, 2*np.pi, 500)
cx,cy = np.cos(a), np.sin(a)

fg, ax = plt.subplots(1, 1)
ax.plot(cx, cy,'-', alpha=.5) # draw unit circle line
ax.plot(x, y, '.') # plot random points
ax.axis('equal')
ax.grid(True)
fg.canvas.draw()
plt.show()

它展示了一个随机点图

或者,您也可以创建一个常规网格并随机扭曲它:

import numpy as np
import matplotlib.pyplot as plt
import matplotlib.tri as tri


n = 20
tt = np.linspace(-1, 1, n)
xx, yy = np.meshgrid(tt, tt)  # create unit square grid
s_x, s_y  = xx.ravel(), yy.ravel()
ii = np.argwhere(s_x**2 + s_y**2 <= 1).ravel() # mask off unwanted points
x, y = s_x[ii], s_y[ii]
triang = tri.Triangulation(x, y) # create triangluar grid


# distort the grid
g = .5 # distortion factor
rx = x + np.random.uniform(low=-g/n, high=g/n, size=x.shape)
ry = y + np.random.uniform(low=-g/n, high=g/n, size=y.shape)

rtri = tri.Triangulation(rx, ry, triang.triangles)  # distorted grid

# for circle:
a = np.linspace(0, 2*np.pi, 500)
cx,cy = np.cos(a), np.sin(a)


fg, ax = plt.subplots(1, 1)
ax.plot(cx, cy,'k-', alpha=.2) # circle line
ax.triplot(triang, "g-", alpha=.4)
ax.triplot(rtri, 'b-', alpha=.5)
ax.axis('equal')
ax.grid(True)
fg.canvas.draw()
plt.show()

它展示了 distorted triangles

这些三角形只是为了可视化而存在。显然的缺点是,根据您选择的网格,无论是在中间还是在边界(如此处所示),由于网格离散化,都将存在更多或更少的大型“孔洞”。


你能否使用网格扭曲技巧在正方形区域内生成最小距离点?如果可以,那么有一些问题可以使用它。这里这里有一些相关的问题。 - Agostino
由于均匀随机分布,最小网格距离为“2./(n-1) - 2.*g/n”,最大距离为“2./(n-1) + 2.*g/n”。可以通过改变“np.random.uniform()”中的参数来调整距离。重要的是要记住,这些点不是按照均匀概率分布进行分布的。 - Dietrich

6

如果你想在一个定义好的区域内(如圆形)生成随机点,最好使用圆的方程并限制半径:

x^2 + y^2 = r^2  (0 < r < R)

或者参数化为两个变量。
cos(a) = x/r
sin(a) = y/r
sin^2(a) + cos^2(a) = 1

要生成类似于低密度的伪随机分布,您应该采取以下方法:
对于随机分布的范围 ra,选择 n 个点。
这样可以使您的分布大致符合密度标准。
要理解为什么这样做有效,请想象将圆首先分成长度为 dr 的小环,现在想象将圆分成角度为 da 的扇形。现在,您的随机性在整个圆周围的方框区域内具有相等的概率。如果您将允许随机性的区域分散在整个圆周围,您将得到更均匀的分布,并为各个区域提供小的随机变化,从而获得所需的伪随机外观和感觉。
现在您只需要为每个给定的区域生成 n 个点。您会希望将 n 设定为依赖于 r,因为每个分区的面积随着移出圆形而改变。您可以按比例调整每个空间带来的确切面积变化:
对于第 n 到第 n+1 个环:
d(Area,n,n-1) = Area(n) - Area(n-1)

任何给定环的面积为:
Area = pi*(dr*n)^2 - pi*(dr*(n-1))

那么差异就在于:
d(Area,n,n-1) = [pi*(dr*n)^2 - pi*(dr*(n-1))^2] - [pi*(dr*(n-1))^2 - pi*(dr*(n-2))^2]
d(Area,n,n-1) = pi*[(dr*n)^2 - 2*(dr*(n-1))^2 + (dr*(n-2))^2]

你可以详细解释一下应该如何增加 n 的数量,但是也可以快速猜测一个百分比的增长(30%之类的)来节省时间。
我提供的示例只是其中的一小部分,减少 dadr 将大大改善你的结果。
以下是生成这些点的初步代码:
import random
import math

R = 10.
n_rings = 10.
n_angles = 10.
dr = 10./n_rings
da = 2*math.pi/n_angles

base_points_per_division = 3
increase_per_level = 1.1
points = []
ring = 0
while ring < n_rings:
    angle = 0
    while angle < n_angles:
        for i in xrange(int(base_points_per_division)):
             ra = angle*da + da*math.random()
             rr = r*dr + dr*random.random()
             x = rr*math.cos(ra)
             y = rr*math.sin(ra)
             points.append((x,y))
        angle += 1
    base_points_per_division = base_points_per_division*increase_per_level
    ring += 1

我用以下参数进行了测试:

n_rings = 20
n_angles = 20
base_points = .9
increase_per_level = 1.1

并获得了以下结果:

enter image description here

它看起来比您提供的图像更密集,但我想进一步调整这些变量可能会有益。

您可以添加一个额外的部分来正确缩放密度,通过计算每个环上的点数。

points_per_ring = densitymath.pi(dr**2)*(2*n+1) points_per_division = points_per_ring/n_angles

这将提供一个更好的比例分布。

density = .03
points = []
ring = 0
while ring < n_rings:
    angle = 0
    base_points_per_division = density*math.pi*(dr**2)*(2*ring+1)/n_angles
    while angle < n_angles:
        for i in xrange(int(base_points_per_division)):
             ra = angle*da + min(da,da*random.random())
             rr = ring*dr + dr*random.random()
             x = rr*math.cos(ra)
             y = rr*math.sin(ra)
             points.append((x,y))
        angle += 1
    ring += 1

使用以下参数可以获得更好的结果。
R = 1.
n_rings = 10.
n_angles = 10.
density = 10/(dr*da)   # ~ ten points per unit area

使用图表可以更直观地了解分布数据。如果你想要一些乐趣,可以用图形展示部门数据,以便更好地匹配分布并进行调整。

enter image description here

enter image description here


5

根据随机点的需求程度,可以简单地在圆盘内制作一个点网格,然后将每个点按一些小但随机的量偏移。


可能这最好是一条注释。(尽管我知道你现在还不能评论。)这个想法可能会有用。 - Gábor Bakos
2
我认为这是一个非常合理的答案,特别是考虑到硬密度限制。 - Benjamin Bannier

4

也许您想要更多的随机性,但是如果您只是想用均匀分布的点填满您的磁盘,这些点不在明显的网格上,那么您可以尝试带有随机相位的螺旋形式。

import math
import random
import pylab

n = 300

alpha = math.pi * (3 - math.sqrt(5))    # the "golden angle"
phase = random.random() * 2 * math.pi
points = []
for k in xrange(n):
  theta = k * alpha + phase
  r = math.sqrt(float(k)/n)
  points.append((r * math.cos(theta), r * math.sin(theta)))

pylab.scatter(*zip(*points))
pylab.show()

enter image description here


与问题中给出的示例相比,这看起来太规则了。 - Mark Ransom

0

概率论保证了拒绝法是一种适当的方法,用于在以原点为中心、半径为r的圆盘D(0,r)内生成均匀分布的点。也就是说,我们可以在正方形[-r,r] x [-r,r]内生成点,直到有一个点落在圆盘内:

do{
  generate P in [-r,r]x[-r,r];
  }while(P[0]**2+P[1]**2>r);
  return P;

unif_rnd_disk 是一个生成器函数,实现了这个拒绝方法:

import matplotlib.pyplot as plt
import numpy as np
import itertools

def unif_rnd_disk(r=1.0):
   pt=np.zeros(2) 
   while True:
      yield pt  
      while True: 
        pt=-r+2*r*np.random.random(2)  
        if (pt[0]**2+pt[1]**2<=r):
            break


G=unif_rnd_disk()# generator of points in disk D(0,r=1)
X,Y=zip(*[pt for pt in itertools.islice(G, 1, 1000)])

plt.scatter(X, Y, color='r', s=3)
plt.axis('equal')

如果我们想要在以C(a,b)为中心的圆盘内生成点,我们必须对圆盘D(0,r)中的点应用平移:
C=[2.0, -3.5]
plt.scatter(C[0]+np.array(X), C[1]+np.array(Y), color='r', s=3)
plt.axis('equal')

网页内容由stack overflow 提供, 点击上面的
可以查看英文原文,
原文链接