我希望在我的脚本中得到Plotly图形库中所有可用标记形状的列表。有关可用形状的文档在这里,但我没有找到一种程序化获取它的方式。
2个回答
4
这个功能已经在plotly.com/python/marker-style/上可用:
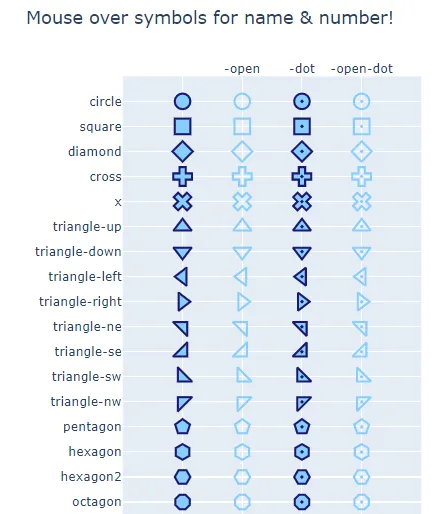
还有很多其他的!运行以下代码片段以查看它们:
import plotly.graph_objects as go
from plotly.validators.scatter.marker import SymbolValidator
# import plotly

raw_symbols = SymbolValidator().values
namestems = []
namevariants = []
symbols = []
for i in range(0,len(raw_symbols),3):
    name = raw_symbols[i+2]
    symbols.append(raw_symbols[i])
    namestems.append(name.replace("-open", "").replace("-dot", ""))
    namevariants.append(name[len(namestems[-1]):])

fig = go.Figure(go.Scatter(mode="markers", x=namevariants, y=namestems, marker_symbol=symbols,
                           marker_line_color="midnightblue", marker_color="lightskyblue",
                           marker_line_width=2, marker_size=15,
                           hovertemplate="name: %{y}%{x}<br>number: %{marker.symbol}<extra></extra>"))
fig.update_layout(title="Mouse over symbols for name & number!",
                  xaxis_range=[-1,4], yaxis_range=[len(set(namestems)),-1],
                  margin=dict(b=0,r=0), xaxis_side="top", height=1400, width=400)
# plotly.offline.plot(fig, filename='C:/plotlyplots/lifeExp.html')
fig.show()
- vestland
0
经过一些尝试和错误,我编写了一个脚本,根据文档说明符号代码是如何形成的,绘制出所有可用的符号:
import numpy as np
import plotly.graph_objects as go


x = np.linspace(0,7,8)
y = np.linspace(0,7,8)

xx,yy = np.meshgrid(x,y)
xx.flatten()
base_coordinates = np.array([xx.flatten()[:53],yy.flatten()[:53]])


a = base_coordinates
b = base_coordinates +10
c = base_coordinates +20
d = base_coordinates +30

traces = [a,b,c,d]
invalid_markers =np.array([225, 226, 227, 228, 229, 230, 231, 232, 233, 234,235, 237,
                           238, 239, 240, 241, 242, 243, 244, 245,246, 247, 248, 249, 250, 251, 252,
                          325, 326, 327, 328, 329, 330, 331, 332, 333, 334,325, 326, 327,
                           328, 329, 330, 331, 332, 333, 334,325, 326, 327, 328, 329, 330, 331, 332, 333, 334,
                          335, 337, 338, 339, 340, 341, 342, 343, 344, 345,346, 347, 348, 349, 350, 351, 352])

base = np.array([x for x in range(0,53)])

markers = [base,base+100,base+200,base+300]
for i,m in enumerate(markers):
    markers[i] = np.where(np.in1d(m,invalid_markers),0,m)
markers


fig = go.Figure()
for i,t in enumerate(traces):
    fig.add_trace(go.Scatter(
        x = t[0],
        y = t[1],
        mode = "markers",
        marker = dict(symbol=markers[i],size = 7),
        text =[f"marker type: {x}" for x in markers[i]]
    ))

fig.show()
这里是结果。
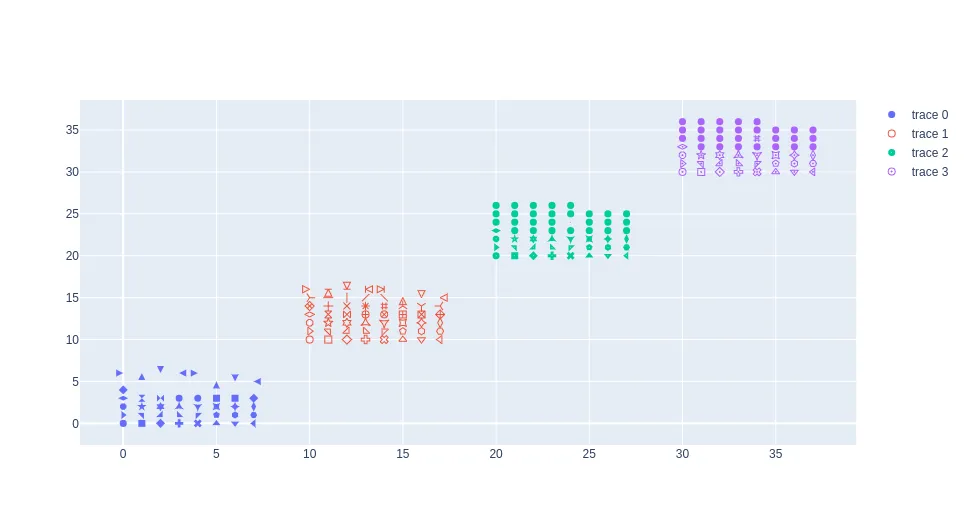
但我仍然在想这个功能是否存在于库中,只是我找不到它。它似乎非常基础,应该会出现在某个地方。
- Amuoeba
网页内容由stack overflow 提供, 点击上面的可以查看英文原文,
原文链接
原文链接