我有一个秘鲁和其州(西班牙语中称为“Departamentos”)的GeoJson文件。
我可以使用leaflet绘制秘鲁的各个州,但由于GeoJson文件没有我需要的所有数据,因此我考虑将其转换为data.frame并添加所需的列数据,然后将其转换回GeoJson格式进行绘图。
数据:您可以从此处下载秘鲁的GeoJson数据:
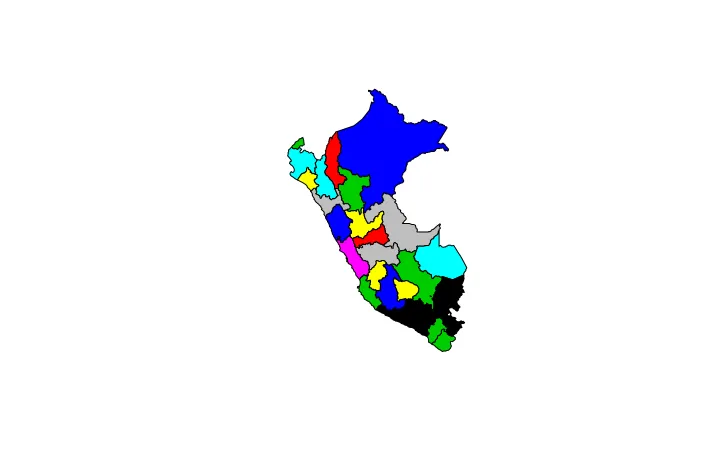
这是我正在使用的数据,我需要向其添加一列销售额数据,并为每个州(“NOMBDEP”-共24个州)添加一行。
我考虑使用“jsonlite”包将“GeoJson”转换为数据框,但是出现了以下错误:
我原本期望在拥有数据框之后,我可以做类似下面的事情:
我可以使用leaflet绘制秘鲁的各个州,但由于GeoJson文件没有我需要的所有数据,因此我考虑将其转换为data.frame并添加所需的列数据,然后将其转换回GeoJson格式进行绘图。
数据:您可以从此处下载秘鲁的GeoJson数据:
这是我正在使用的数据,我需要向其添加一列销售额数据,并为每个州(“NOMBDEP”-共24个州)添加一行。
library(leaflet)
library(jsonlite)
library(dplyr)


states <- geojsonio::geojson_read("https://raw.githubusercontent.com/juaneladio/peru-geojson/master/peru_departamental_simple.geojson", what = "sp")
我考虑使用“jsonlite”包将“GeoJson”转换为数据框,但是出现了以下错误:
library(jsonlite)

states <- fromJSON(states)

Error: Argument 'txt' must be a JSON string, URL or file.
我原本期望在拥有数据框之后,我可以做类似下面的事情:
states$sales #sales is a vector with the sales for every department

states <- toJson(states)