如何给一个移动的散点图添加动画效果

4

我是Python的初学者。我正在尝试制作一个点在水平方向移动的动画。但是,当我运行代码时,我收到了以下错误:

TypeError: 'PathCollection' object is not iterable

我不知道该如何修复它。

#----------------------------------------------------------------------
import numpy as np
import matplotlib
import matplotlib.pyplot as plt
from matplotlib.animation import FuncAnimation

Acc_11 = [1,2,3,4,6,7]
lenAcc11 = len(Acc_11)
Acc_12 = [2,2,2,2,2,2]

# Scatter plot
fig = plt.figure(figsize = (5,5))
ax = plt.axes()
scat = ax.scatter([],[])

#initial func
def init():
    return scat 
#animation func
def ani (i):

    for i in range(0,lenAcc11):
        acc_11 = Acc_11[i]
        print (acc_11)
        acc_11_pos = Acc_12[i]
        print (acc_11_pos)
    scat = scat.set_data(acc_11,acc_11_pos)
    return scat
ani = FuncAnimation(fig, ani, init_func = init, interval = 10, blit =True)

plt.show()             


#--------------------------------------------------------------------------
这里有一个关于散点图动画的类似问题链接,希望能解决你的问题。此外,散点图句柄没有set_data方法,请尝试使用set_array - hashmuke
1个回答

6

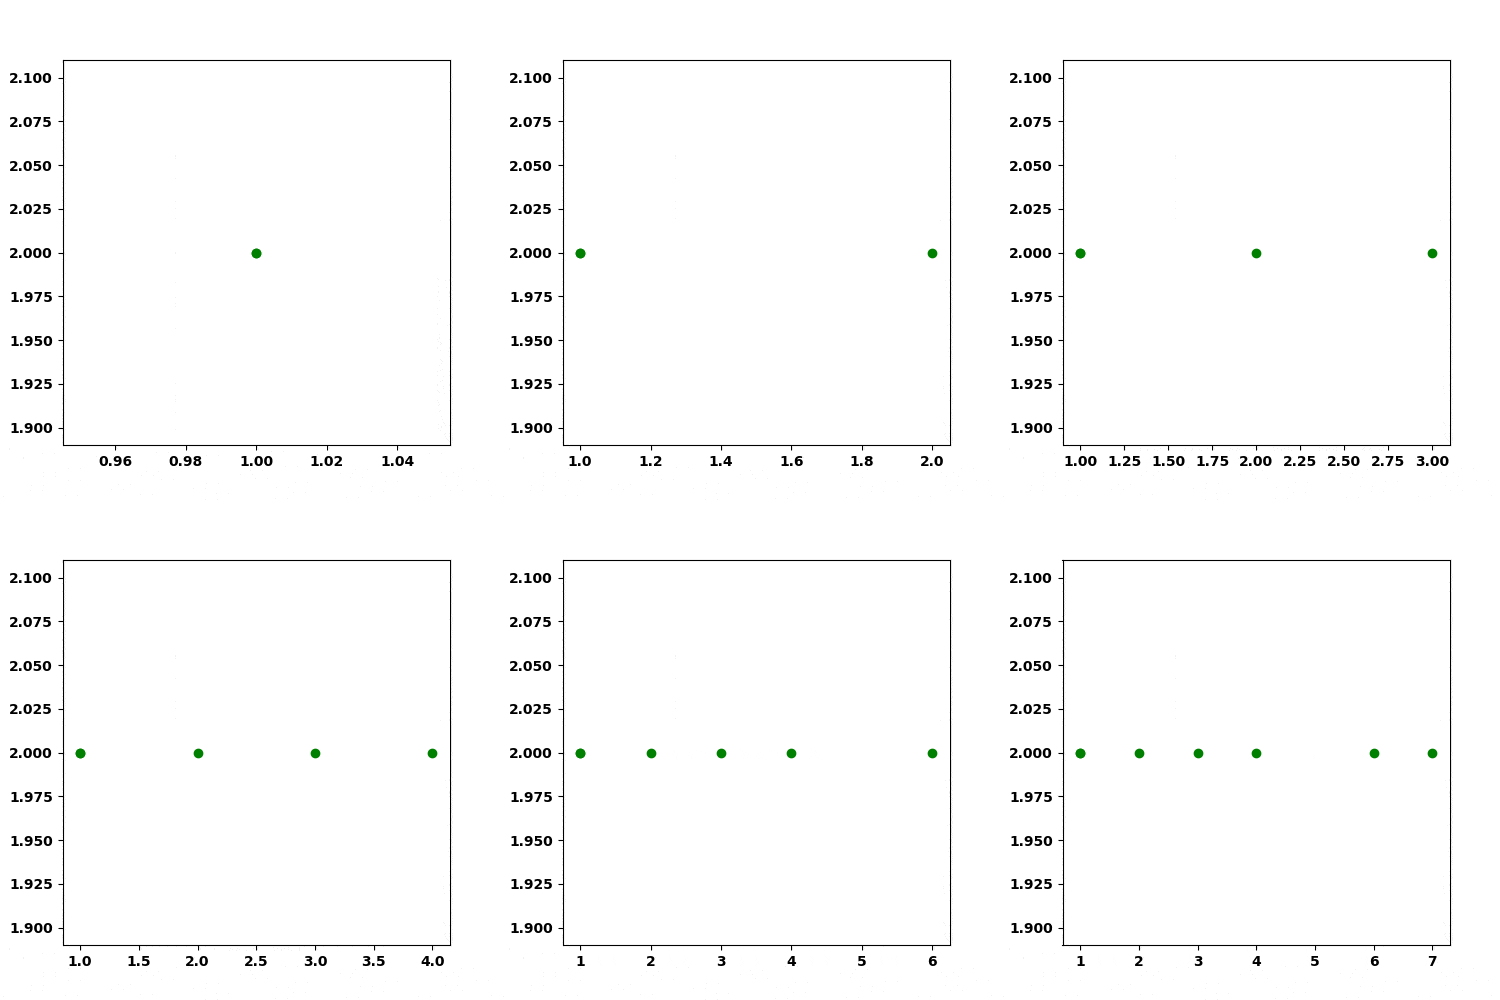
显示所有点

这将显示所有点:

import matplotlib.pyplot as plt
from matplotlib.animation import FuncAnimation

Acc_11 = [1,2,3,4,6,7]
Acc_12 = [2,2,2,2,2,2]

# Scatter plot
fig = plt.figure(figsize = (5,5))


def ani(coords):
     return plt.scatter([coords[0]],[coords[1]], color='g')

def frames():
    for acc_11_pos, acc_12_pos in zip(Acc_11, Acc_12):
        yield acc_11_pos, acc_12_pos

ani = FuncAnimation(fig, ani, frames=frames, interval=1000)

plt.show()

enter image description here

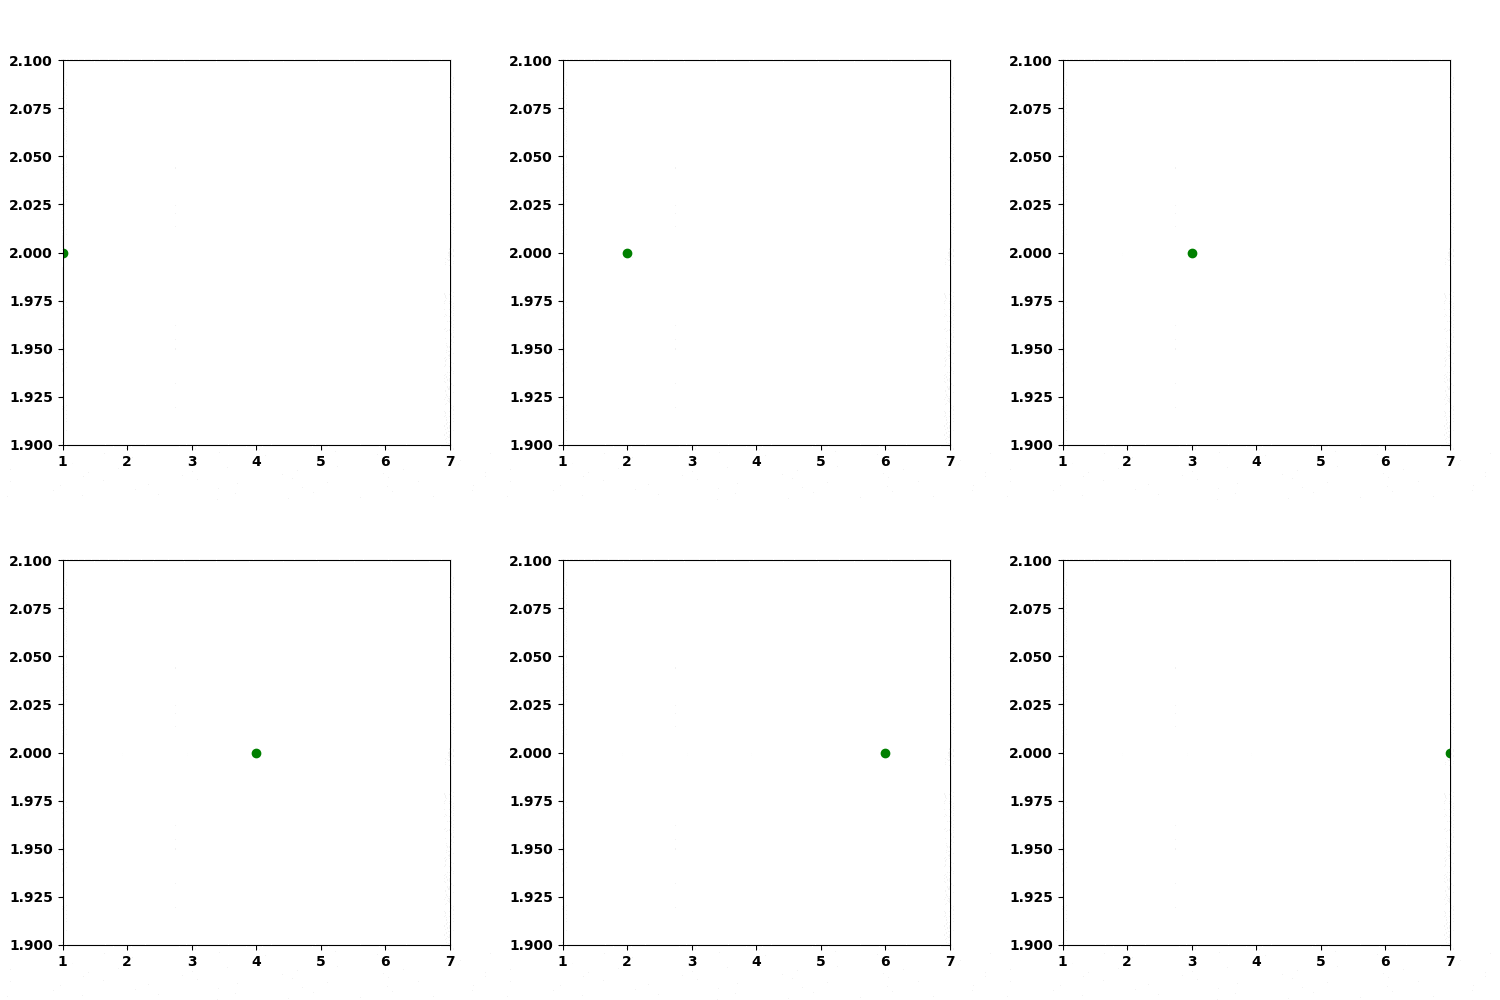
只显示一个移动点

这将一次只显示一个点:

import matplotlib.pyplot as plt
from matplotlib.animation import FuncAnimation

Acc_11 = [1,2,3,4,6,7]
Acc_12 = [2,2,2,2,2,2]

# Scatter plot
fig = plt.figure(figsize = (5,5))
axes = fig.add_subplot(111)
axes.set_xlim(min(Acc_11), max(Acc_11))
axes.set_ylim(min(Acc_12), max(Acc_12))

point, = axes.plot([Acc_11[0]],[Acc_12[0]], 'go')

def ani(coords):
    point.set_data([coords[0]],[coords[1]])
    return point

def frames():
    for acc_11_pos, acc_12_pos in zip(Acc_11, Acc_12):
        yield acc_11_pos, acc_12_pos

ani = FuncAnimation(fig, ani, frames=frames, interval=1000)

plt.show()

enter image description here

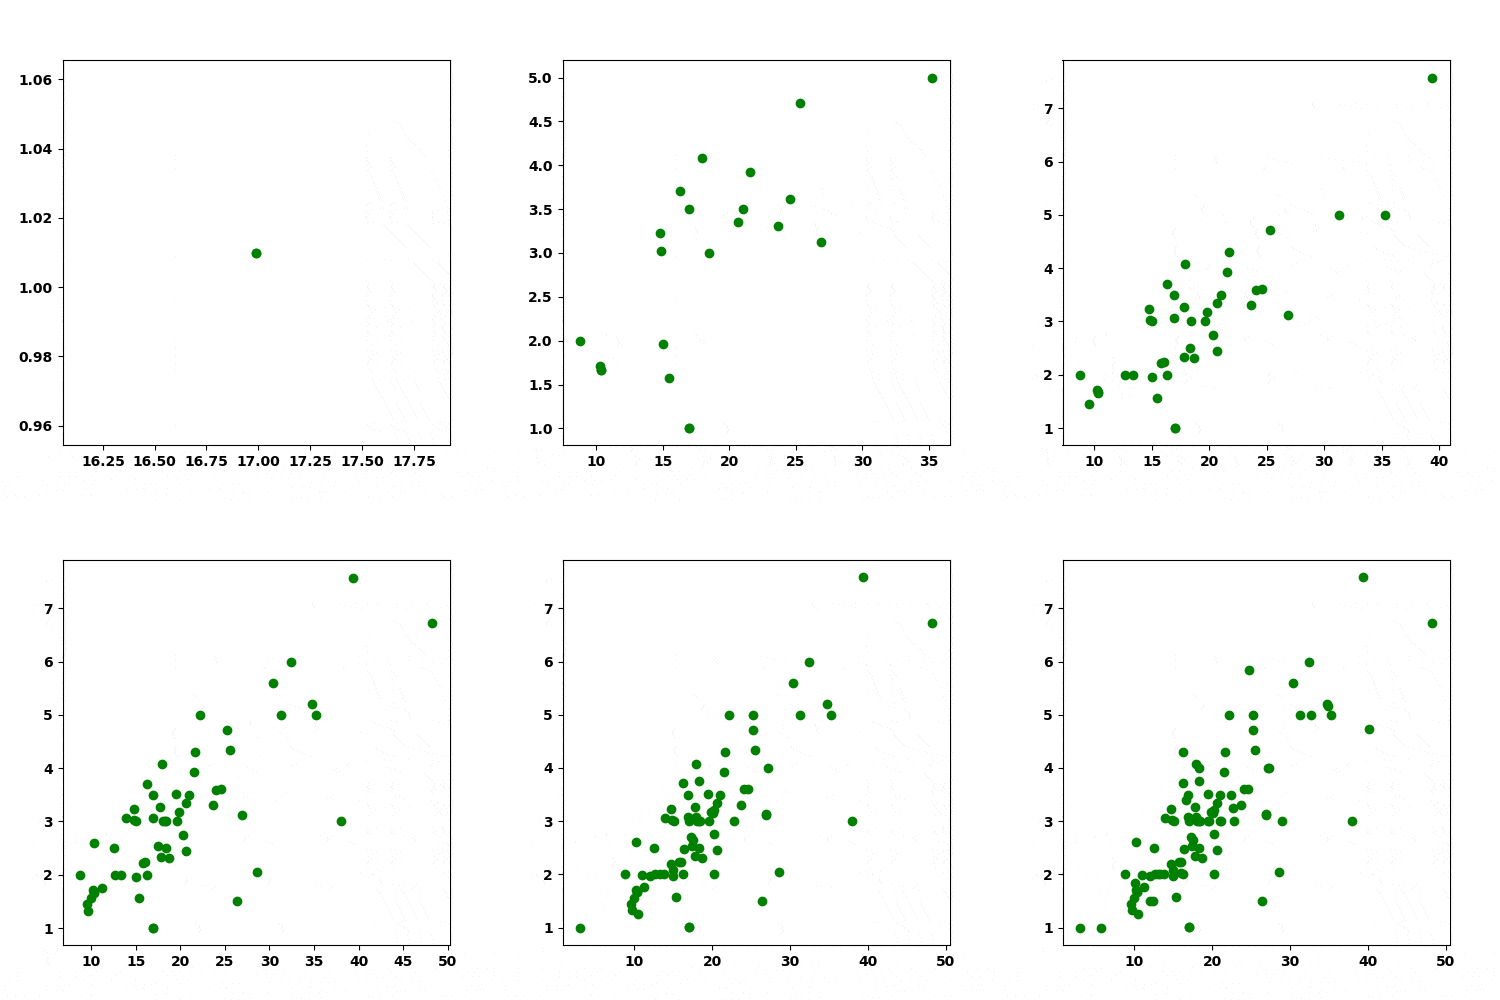
从数据框中而非列表中获取数据

  • 使用数据框时,前面两种选项都能正常工作。将Acc_11 = 设置为x轴的数据框列,将Acc_12 = 设置为y轴的数据框列。
import seaborn as sns

# sample dataframe
tips = sns.load_dataset('tips')

x = tips.total_bill
y = tips.tip

# Scatter plot
fig = plt.figure(figsize = (5,5))

def ani(coords):
     return plt.scatter([coords[0]], [coords[1]], color='g')

    
def frames():
    for x_pos, y_pos in zip(x, y):
        yield x_pos, y_pos

        
ani = animation.FuncAnimation(fig, ani, frames=frames, interval=1000)
ani.save('animation2.gif', fps=30)

plt.show()

enter image description here


网页内容由stack overflow 提供, 点击上面的
可以查看英文原文,
原文链接