我想创建一个图并绘制它,目前为止一切都很好,但问题是我想在每个节点上绘制更多的信息。我看到可以将属性保存到节点/边缘,但如何绘制这些属性呢?我正在使用PyGraphviz,它使用Graphviz。
3个回答
4
一个例子可以是:
import pygraphviz as pgv
from pygraphviz import *
G=pgv.AGraph()
ndlist = [1,2,3]
for node in ndlist:
    label = "Label #" + str(node)
    G.add_node(node, label=label)
G.layout()
G.draw('example.png', format='png')
但是请确保您显式添加属性label以显示额外信息,正如Martin在https://dev59.com/fm_Xa4cB1Zd3GeqP14E9#15456323中所提到的。
- Sean
1
注意:对于任何试图重复使用此答案的人,您必须将要显示的属性命名为“label”。 - Charlie Parker
0
如果您已经有一个带有某些属性的图形需要标记,可以使用以下方法:
def draw_nx_with_pygraphviz_attribtes_as_labels(g, attribute_name, path2file=None):
    import matplotlib.pyplot as plt
    import matplotlib.image as mpimg

    # https://dev59.com/fm_Xa4cB1Zd3GeqP14E9

    if path2file is None:
        path2file = './example.png'
        path2file = Path(path2file).expanduser()

    g = nx.nx_agraph.to_agraph(g)
    # to label in pygrapviz make sure to have the AGraph obj have the label attribute set on the nodes
    g = str(g)
    g = g.replace(attribute_name, 'label')  # it only
    print(g)
    g = pgv.AGraph(g)
    g.layout()
    g.draw(path2file)

    # https://dev59.com/7HrZa4cB1Zd3GeqP0Ub4
    img = mpimg.imread(path2file)
    plt.imshow(img)
    plt.show()

    # remove file https://dev59.com/kGw05IYBdhLWcg3w11Qk
    path2file.unlink()

# -- tests

def test_draw():
    # import pylab
    import networkx as nx
    g = nx.Graph()
    g.add_node('Golf', size='small')
    g.add_node('Hummer', size='huge')
    g.add_node('Soccer', size='huge')
    g.add_edge('Golf', 'Hummer')
    draw_nx_with_pygraphviz_attribtes_as_labels(g, attribute_name='size')

if __name__ == '__main__':
    test_draw()
结果:
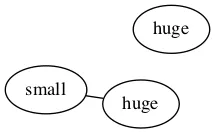
特别注意的是,这两个“huge”并没有变成自环,它们是两个不同的节点(例如,两个运动项目可能很大,但它们不是同一个运动/实体)。
与nx相关的绘图:使用节点标签默认为节点名称绘制networkx图形
- Charlie Parker
网页内容由stack overflow 提供, 点击上面的可以查看英文原文,
原文链接
原文链接