假设我有一个列表中包含两个数据框:
sm = pd.DataFrame([["Forever", 'BenHarper'],["Steel My Kisses", 'Kack Johnson'],\
                  ["Diamond On the Inside",'Xavier Rudd'],[ "Count On Me", "Bruno Mars"]],\
                   columns=["Song", "Artist"])

pm = pd.DataFrame([["I am yours", 'Jack Johnson'],["Chasing Cars", 'Snow Patrol'],\
                  ["Kingdom Comes",'Cold Play'],[ "Time of your life", "GreenDay"]],\
                   columns=["Song", "Artist"])

df_list = [sm,pm]
现在,当我想在迭代时打印两个数据框时,我会得到类似这样的结果,
for i in df_list:
    print(i)
结果,
                  Song        Artist
0                Forever     BenHarper
1        Steel My Kisses  Kack Johnson
2  Diamond On the Inside   Xavier Rudd
3            Count On Me    Bruno Mars
                Song        Artist
0         I am yours  Jack Johnson
1       Chasing Cars   Snow Patrol
2      Kingdom Comes     Cold Play
3  Time of your life      GreenDay
然而,当我们执行df_list[0]时,它以一种令人愉悦的表格方式打印出来,
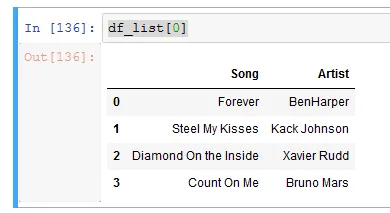
当我遍历列表并打印数据帧时,我能以一种视觉上令人愉悦的方式获得相同的结果吗?我一直在搜索,但还没有找到合适的方法。有没有想法如何做到这一点?
(抱歉,如果这是Python中正常的事情,因为我是新手,看到视觉效果好的结果会让我感到高兴)
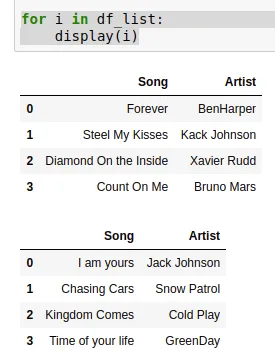
from IPython.display import display! - Parfait