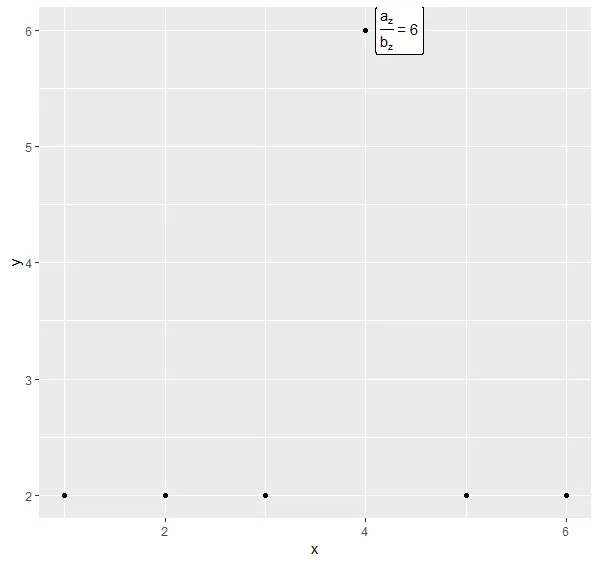
我的数据:
dat <- data_frame(x = c(1,2,3,4,5,6), y = c(2,2,2,6,2,2))
我希望能在点(x=4,y=6)旁边显示这个表达式:
expression <- bquote(paste(frac(a[z], b[z]), " = ", .(dat[which.max(dat$y),"y"] %>% as.numeric())))
但是,当我在使用ggplot时使用这个表达式:
ggplot() +
  geom_point(data = dat, aes(x = x, y = y)) +
  geom_label(data = dat[which.max(dat$y),], aes(x = x, y = y, label = expression))
我收到了这个错误信息:
Error: Aesthetics must be either length 1 or the same as the data (1): label
ggplot调用中定义aes几乎总是更好。但最终,我想这也与风格有关。如果您知道所有图都将使用相同的aes- 那么当然,在主要调用中定义它。 - tjebo