使用Matplotlib制作动态子图

22
我有这段代码。我想添加一个子图来绘制余弦函数。(我不想创建一个类)。第二个图也应该动态更新。
import numpy as np
import matplotlib.pyplot as plt
import matplotlib.animation as animation

def data_gen():
    t = data_gen.t
    cnt = 0
    while cnt < 1000:
        cnt+=1
        t += 0.05
        yield t, np.sin(2*np.pi*t) * np.exp(-t/10.)
data_gen.t = 0

fig, ax = plt.subplots()
line, = ax.plot([], [], lw=2)
ax.set_ylim(-1.1, 1.1)
ax.set_xlim(0, 5)
ax.grid()
xdata, ydata = [], []
def run(data):
    # update the data
    t,y = data
    xdata.append(t)
    ydata.append(y)
    xmin, xmax = ax.get_xlim()

    if t >= xmax:
        ax.set_xlim(xmin, 2*xmax)
        ax.figure.canvas.draw()
    line.set_data(xdata, ydata)

    return line,

ani = animation.FuncAnimation(fig, run, data_gen, blit=True, interval=10,
    repeat=False)
plt.show()
1个回答

42

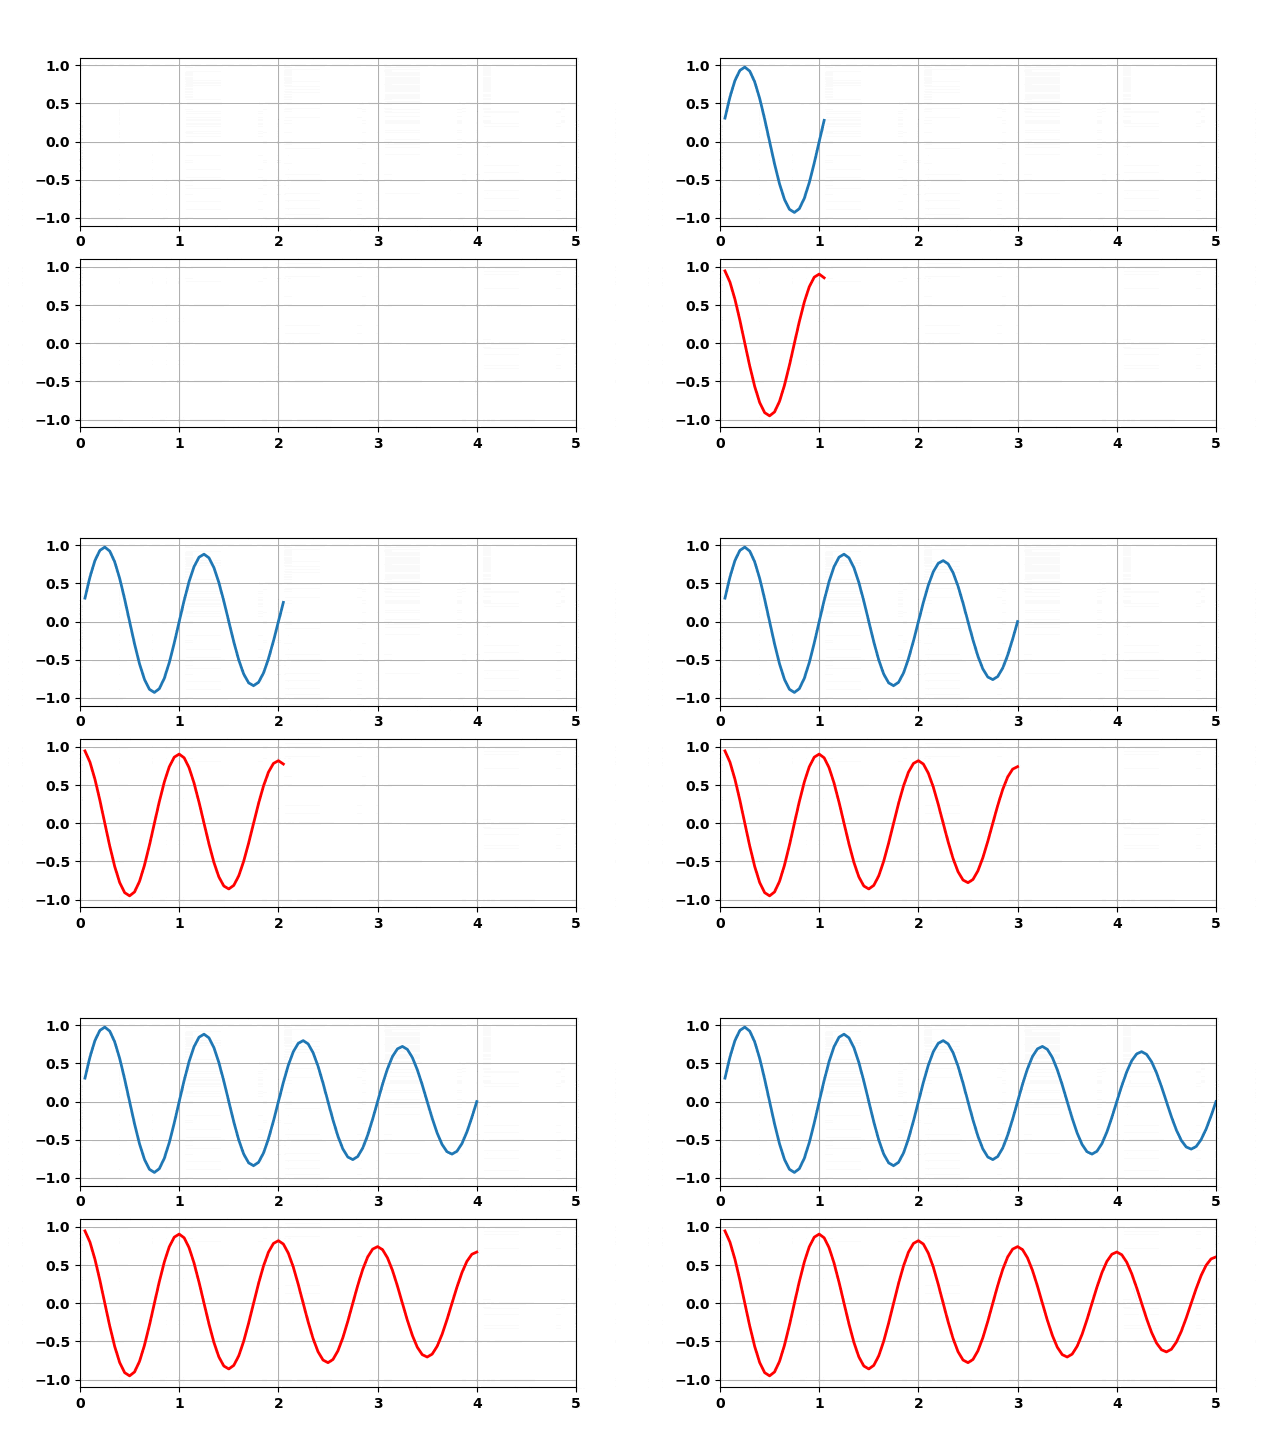
基本上,您可以使用与示例中相似的结构。 您只需要创建一个额外的轴(subplot)和第二个线条对象:

import numpy as np
import matplotlib.pyplot as plt
import matplotlib.animation as animation

def data_gen():
    t = data_gen.t
    cnt = 0
    while cnt < 1000:
        cnt+=1
        t += 0.05
        y1 = np.sin(2*np.pi*t) * np.exp(-t/10.)
        y2 = np.cos(2*np.pi*t) * np.exp(-t/10.)
        # adapted the data generator to yield both sin and cos
        yield t, y1, y2

data_gen.t = 0

# create a figure with two subplots
fig, (ax1, ax2) = plt.subplots(2,1)

# intialize two line objects (one in each axes)
line1, = ax1.plot([], [], lw=2)
line2, = ax2.plot([], [], lw=2, color='r')
line = [line1, line2]

# the same axes initalizations as before (just now we do it for both of them)
for ax in [ax1, ax2]:
    ax.set_ylim(-1.1, 1.1)
    ax.set_xlim(0, 5)
    ax.grid()

# initialize the data arrays 
xdata, y1data, y2data = [], [], []
def run(data):
    # update the data
    t, y1, y2 = data
    xdata.append(t)
    y1data.append(y1)
    y2data.append(y2)

    # axis limits checking. Same as before, just for both axes
    for ax in [ax1, ax2]:
        xmin, xmax = ax.get_xlim()
        if t >= xmax:
            ax.set_xlim(xmin, 2*xmax)
            ax.figure.canvas.draw()

    # update the data of both line objects
    line[0].set_data(xdata, y1data)
    line[1].set_data(xdata, y2data)

    return line

ani = animation.FuncAnimation(fig, run, data_gen, blit=True, interval=10,
    repeat=False)
plt.show()

enter image description here


你能解释一下 line1, = ax1.plot([], [], lw=2) 和 line1 = ax1.plot([], [], lw=2)(第二个版本缺少逗号)之间的区别吗? - ZakS
3
ax1.plot 返回一个(可能包含多条)线段的列表。使用逗号,该列表的第一个元素被赋值给 line1。如果没有逗号,line1 将包含整个列表。 - hitzg
如果需要在同一子图上绘制y1和y2,但data_gen是带有某些输入参数k的函数,则应如何修改此代码。因此,每个子图显示不同的k值。 - Yograj Singh Mandloi
如何在jupyter notebook上运行它?添加%matplotlib inline无效。 - MattS
@MattS %matplotlib notebook - Indivara
使用“line1,= ax1.plot([], [], lw = 2)”这一行代码时,我遇到了一个错误,提示有太多的值需要解包(期望为1)……如果我在“line[0].set_data(xdata, y1data)”这一行中删除逗号,则会出现错误:“元组”对象没有“set_data”属性。 - Jonathan Roy

网页内容由stack overflow 提供, 点击上面的
可以查看英文原文,
原文链接