我想在使用 echarts.js(v1)(https://ecomfe.github.io/)构建的图表中将数字转换为土耳其里拉货币。您可以在下面看到我的图表和 echarts.js 代码。
更新:这是 jsfiddle 链接:https://jsfiddle.net/johnvaldetine/wmxtLoyu/3/
我的图表:
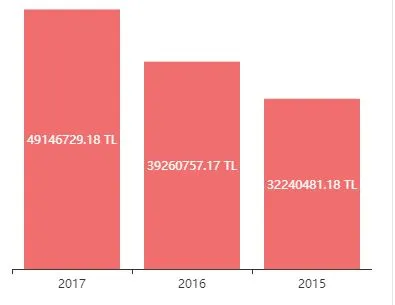
正如您所见,这个例子中的数字不容易阅读。因此,我想将“49146729.18 TL”转换为“49.146.729,18 TL”。(在土耳其语中,我们用“.”(句点)分隔千位数,用“,”(逗号)分隔小数。)
以下是我的 echarts.js 代码:// based on prepared DOM, initialize echarts instance
var myChart = echarts.init(document.getElementById('Cirolar'));
// specify chart configuration item and data
var option = {
color: ['#ef6e6e'],
tooltip: {
formatter: '{c} TL',
},
grid: {
width: '100%',
left: '0%',
top: '1%',
bottom: '1%',
containLabel: true
},
xAxis: {
data: ["2017", "2016", "2015"]
},
yAxis: {
axisLine: {
show: false
},
axisLabel: {
show: false
},
axisTick: {
show: false
},
splitLine: {
show: false
}
},
series: [{
name: 'Ciro',
type: 'bar',
// data: [5, 20, 36, 10, 10, 20]
data: [{
value: price2017.replace(/,/g, '.'),
name: '2017'
},
{
value: price2016.replace(/,/g, '.'),
name: '2016'
},
{
value: price2015.replace(/,/g, '.'),
name: '2015'
}
],
label: {
normal: {
formatter: '{c} TL',
show: true,
position: 'inside'
},
}
}]
};
// use configuration item and data specified to show chart
myChart.setOption(option);
更新:这是 jsfiddle 链接:https://jsfiddle.net/johnvaldetine/wmxtLoyu/3/