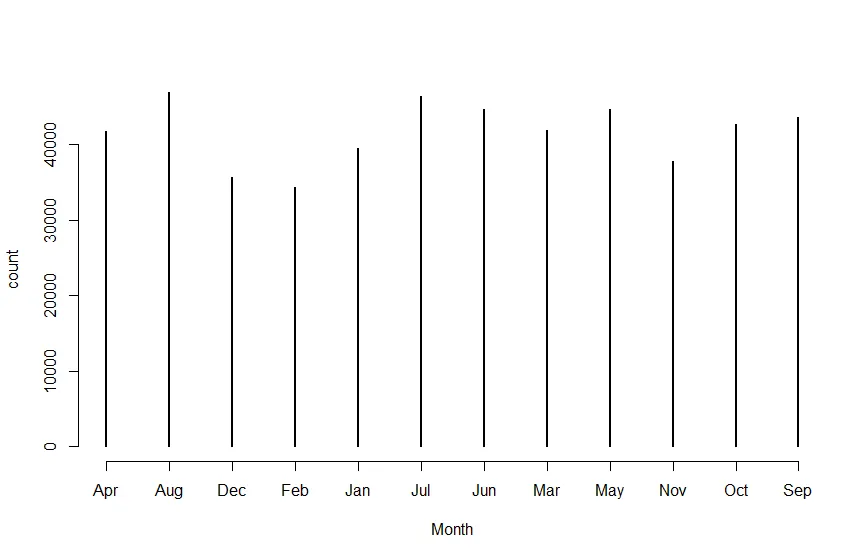
我想使用月份制作图表,但是x轴的顺序并不是按照顺序排列的,例如"Apr","Aug","Nov"...... 但是我希望x轴的顺序是"Jan", "Feb", "Mar"......
#change the format of date
date_month <- format(date_1, "%b")
class(date_month)
[1] "character"

head(date_month)
[1] "Jul" "Jul" "Jul" "Jul" "Jul" "Jul"

plot(table(date_month), xlab = "Month", ylab = "count")
我尝试了这个:
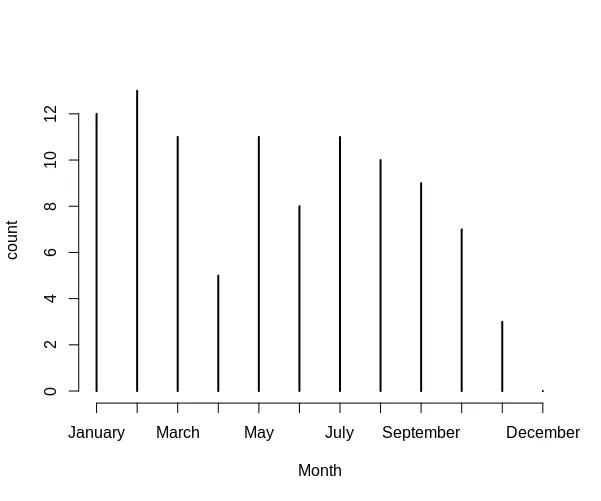
x1  <- factor(date_month, levels=c("Jan", "Feb", "Mar", "Apr", "May", "Jun", "Jul",  "Aug", "Sep", "Oct", "Nov","Dec"))
plot(y ~ x1)
并且:
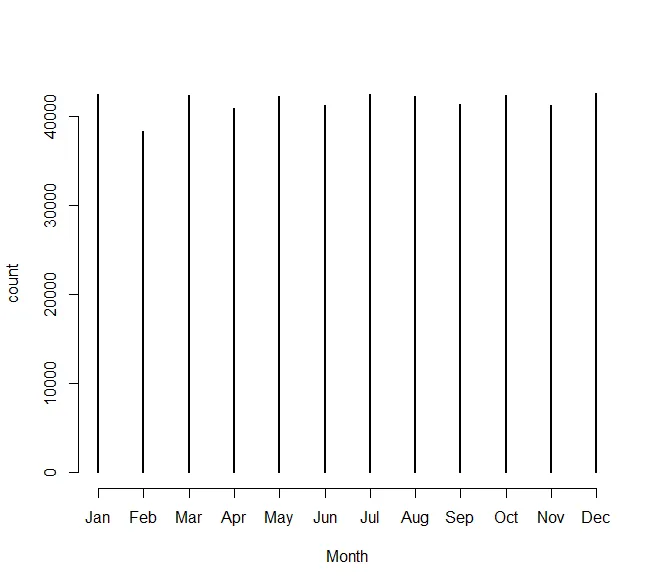
plot(table(date_month), xlab = "Month", ylab = "count")
axis(date_month,labels = c("Jan", "Feb", "Mar", "Apr", "May", "Jun", "Jul",  "Aug", "Sep", "Oct", "Nov","Dec"))
完全不起作用。有人能帮我解决这个问题吗?非常感谢。