我正在寻找一种特定类型的Javascript或SVG图表库,类似于Google Chart(示例)
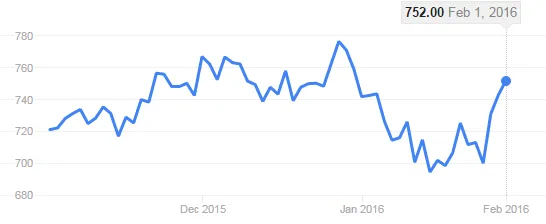
我已经搜索了一段时间,但找不到与此风格相似的东西,我想知道是否有人能够指导我如何实现类似的最终结果。
我已经研究了Google Visualization API并尝试在JSFiddle中制作了一个线形图,但似乎无法复制那种设计风格。 有什么建议吗?
See Example Image
Javascript、SVG和AngularJS都可以作为奖励的选项。使用SVG将获得额外加分。
我正在寻找一种特定类型的Javascript或SVG图表库,类似于Google Chart(示例)
我已经搜索了一段时间,但找不到与此风格相似的东西,我想知道是否有人能够指导我如何实现类似的最终结果。
我已经研究了Google Visualization API并尝试在JSFiddle中制作了一个线形图,但似乎无法复制那种设计风格。 有什么建议吗?
See Example Image
Javascript、SVG和AngularJS都可以作为奖励的选项。使用SVG将获得额外加分。
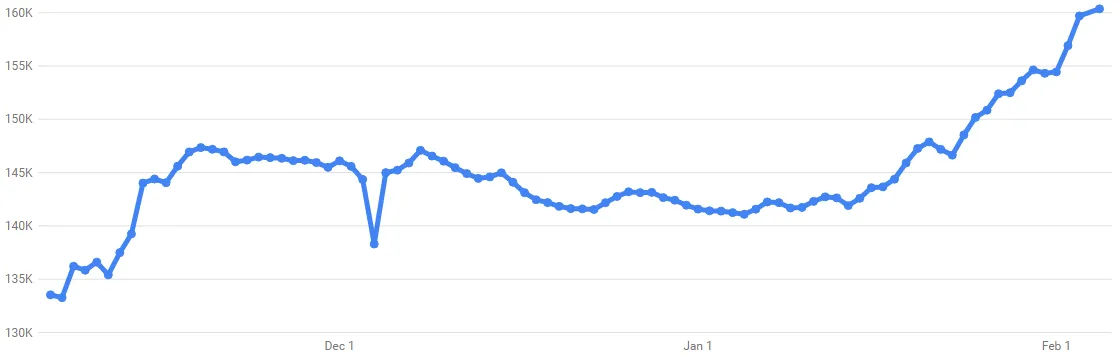
这是我在满足要求的情况下所能做到的最接近的效果,我认为我已经做得很好了。
如果您希望当鼠标悬停在图表上时始终显示工具提示(例如:Google Trends),可以通过focusTarget选项(JSFiddle示例)来实现,但目前仅适用于Classic Google charts而不是新的material charts。
google.charts.load('current', { packages: ['line'] });
google.charts.setOnLoadCallback(drawBasic);

function drawBasic() {

  var data = new google.visualization.DataTable();
  data.addColumn('date', 'X');
  data.addColumn('number', 'Dogs');

  data.addRows([
    [new Date(2015, 9, 28), 6],
    [new Date(2015, 9, 29), 10],
    [new Date(2015, 9, 30), 19],
    [new Date(2015, 10, 0), 14],
    [new Date(2015, 10, 1), 16],

  ]);

  var options = {
    colors: ["#4184F3"],
    lineWidth: 3,
    legend: {
      position: "none"
    },
    hAxis: {
      pointSize: 2,
      format: 'MMM d',
      title: '',
      titlePosition: 'none'
    },
    vAxis: {
      title: 'Popularity'
    }
  };

  var chart = new google.charts.Line(document.getElementById('chart_div'));
  chart.draw(data, google.charts.Line.convertOptions(options));
}
#chart_div svg g circle {
stroke: #4184F3 !important;
fill-opacity: 1;
r: 5;
fill: #4184F3 !important;
filter: none !important;
}
#chart_div svg g circle:hover {
r: 8
}
#chart_div svg g path {
stroke-width: 4 !important;
stroke: #4184F3 !important;
stroke-linejoin: bevel;
stroke-width: 1;
stroke-linecap: round;
filter: none !important;
}<script type="text/javascript" src="https://www.gstatic.com/charts/loader.js"></script>
<div id="chart_div"></div>