我在网上和matplotlib文档中寻找了很久,但似乎没有一个简单直接的解决方案来解决这个看似简单的问题。我正在使用imshow()函数创建一个矩阵的热力图,并且使用diverging cmap(coolwarm),我希望将0表示为白色,正值表示为红色,负值表示为蓝色。有没有人知道一种不需要创建自定义cmap的简便方法?
使用imshow()函数将0表示为白色。
3
- William Gazeley
2
https://matplotlib.org/3.2.1/gallery/userdemo/colormap_normalizations_diverging.html - undefined
这个回答解决了你的问题吗?Python颜色映射,但所有零值都映射为黑色 - undefined
1个回答
2
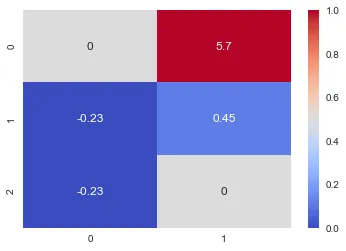
通过使用最小-最大归一化,原始数据中的零被移动,因此请按照下面所示的方式将零进行移动。以下是我想出的一种方法。
data = np.array([[0.000000,5.67],[-0.231049,0.45],[-0.231049,0.000000]])

k=(data-np.min(data))/(np.max(data)-np.min(data)) # Min-max Normalization

nsv_zero =-np.min(data)/(np.max(data)-np.min(data))  # new shifted value of zero

sns.heatmap(np.where( k == nsv_zero ,0.5 ,k),vmin=0,vmax=1,cmap='coolwarm',annot=data)


* Min-Max Normalization : Scale all the values to new range(0,1)
* Shifting zero in initial data to 0.5 in the new output data so as to get white color
* Here I am using modified data on heatmap, but I am using the original annotations only.
希望这个输出更接近您所需的内容。
- sushmanth natha
网页内容由stack overflow 提供, 点击上面的可以查看英文原文,
原文链接
原文链接
- 相关问题
- 52 OpenCV错误:在imshow函数中,size.width>0且size.height>0。
- 3 将matplotlib imshow裁剪为值的范围
- 3 BIT 0被表示为'\x00'
- 4 将图像中的白色空白部分变为透明,覆盖到imshow()上。
- 12 使用Matplotlib imshow()函数能否将2D数组显示为极坐标图?
- 11 使用Matplotlib imshow将没有数据的点设置为白色
- 3 将B样条函数表示为分段三次函数
- 16 imshow(img,cmap = cm.gray)显示128值的白色。
- 20 断言失败:size.width>0 && size.height>0 在imshow函数中。
- 4 Python的matplotlib imshow总是给我白色,无论我发送一组1或0的数组。