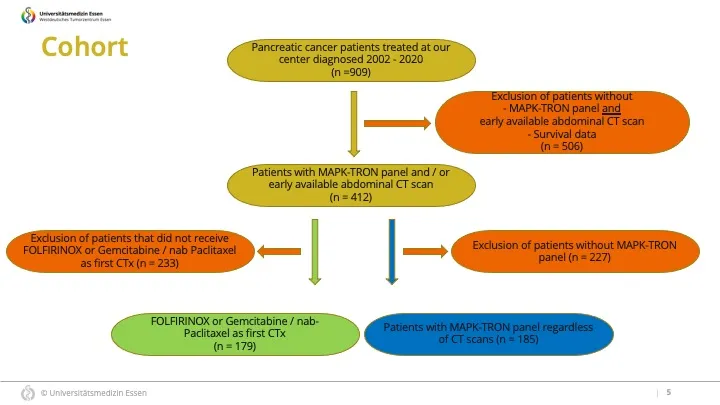
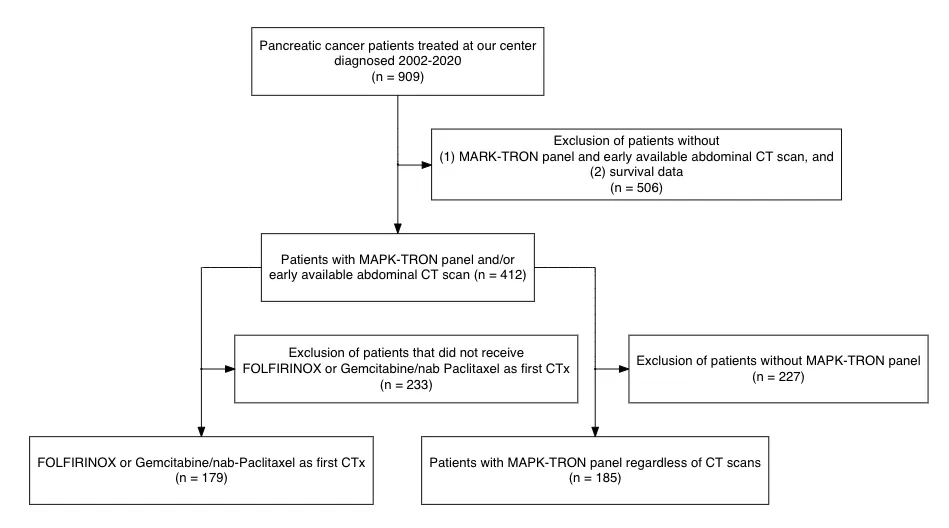
我一整天都在努力创建一个流程图,代表我们在研究中所包含的某些患者。
我已经在Power Point演示文稿中准备好了一个草稿版本,描绘了我正在寻找的排列方式。 现在,我已经准备好了所有的框,但是我需要与附图中相同的箭头对齐和连接。我尝试复制并粘贴了这个页面上的指南https://cran.r-project.org/web/packages/Gmisc/vignettes/Grid-based_flowcharts.html,但是现在我卡住了。由于我在使用R方面的专业知识很少,只有偶尔使用它,你可能会看到一些容易的东西,我却看不到。
这是我的代码:
我会坦诚地说:在 "grid.newpage()" 之后的代码我不太理解。因此,我一直在尝试理解代码组件实际执行的操作,但每次我认为我已经理解了它的工作原理时,又会有另一个挫折等着我。
R基本上给我一个箭头和盒子到处都是的图表,但并不是我想要的样子。然后有时我的盒子甚至太大或什么的?特别是图表末尾的两个子组的盒子经常被切断...
你有没有想法如何“强制”R为我复制那种图表(见图片)?
非常感谢您的帮助,这将使我更接近最终完成论文...!
提前致谢!
我已经在Power Point演示文稿中准备好了一个草稿版本,描绘了我正在寻找的排列方式。 现在,我已经准备好了所有的框,但是我需要与附图中相同的箭头对齐和连接。我尝试复制并粘贴了这个页面上的指南https://cran.r-project.org/web/packages/Gmisc/vignettes/Grid-based_flowcharts.html,但是现在我卡住了。由于我在使用R方面的专业知识很少,只有偶尔使用它,你可能会看到一些容易的东西,我却看不到。
这是我的代码:
  install.packages("Gmisc")
library(Gmisc, quietly = TRUE)
library(glue)
library(htmlTable)
library(grid)
library(magrittr)

org_cohort <- boxGrob(glue("Patients with pancreatic cancer admitted to the University Clinic of Essen",
                           "from 01/2002 to 08/2020",
                           "n = {pop}",
                           pop = txtInt(909),
                           .sep = "\n"))
included <- boxGrob(glue("Patients with genetic sequencing and survival data",
                         "n = {incl}",
                         incl = txtInt(412),
                         .sep = "\n"))
grp_a <- boxGrob(glue("Patients treated with FOLFIRINOX or Gemcitabine / nab-Paclitaxel",
                      "n = {recr}",
                      recr = txtInt(179),
                      .sep = "\n"))

grp_b <- boxGrob(glue("Patients with genetic sequencing data via MAPK-TRON panel",
                      "n = {recr}",
                      recr = txtInt(185),
                      .sep = "\n"))

excluded_1 <- boxGrob(glue("Excluded (n = {tot}):",
                         " - No survival data: {NoSurv}",
                         " - No MAPK-Tron panel and early available abdominal CT-scan: {NoMAPKCT}",
                         tot = 506,
                         NoSurv = 300,
                         NoMAPKCT = 206,
                         .sep = "\n"),
                    just = "left")

excluded_2 <- boxGrob(glue("Excluded (n = {NoFGP}):",
                           " - No FOLFIRINOX or Gemcitabine / nab-Paclitaxel as 1st line: {NoFGP}",
                           NoFGP = 233,
                           .sep = "\n"),
                      just = "left")

excluded_3 <- boxGrob(glue("Excluded (n = {NoMAPK}):",
                           " - No sequencing data available: {NoMAPK}",
                           NoMAPK = 227,
                           .sep = "\n"),
                      just = "left")

grid.newpage()
vert <- spreadVertical(org_cohort = org_cohort,
                       included = included,
                       grps = grp_a)
grps <- alignVertical(reference = vert$grp_a,
                      grp_a, grp_b) %>%
  spreadHorizontal()
vert$grps <- NULL

excluded_1 <- moveBox(excluded_1,
                    x = .8,
                    y = coords(vert$included)$top + distance(vert$included, vert$org_cohort, half = TRUE, center = FALSE))

excluded_2 <- moveBox(excluded_2,
                      x = .8,
                      y = coords(vert$grp_a)$top + distance(vert$included, vert$grp_a, half = TRUE, center = FALSE))

excluded_3 <- moveBox(excluded_3,
                      x = .8,
                      y = coords(vert$grp_b)$bottom + distance(vert$included, vert$grp_b, half = TRUE, center = FALSE))

## already facing problems here: R gives me the following error message: Error in coords(vert$grp_a/b) :
  #Assertion on 'box' failed: Must inherit from class 'box', but has class 'NULL'..

for (i in 1:(length(vert) - 1)) {
  connectGrob(vert[[i]], vert[[i + 1]], type = "vert") %>%
    print
}
connectGrob(vert$included, grps[[1]], type = "N")
connectGrob(vert$included, grps[[2]], type = "N")

connectGrob(vert$included, excluded_1, type = "L")
connectGrob(vert$grp_a, excluded_2, type = "L")


# Print boxes
vert
grps
excluded_1
excluded_2
excluded_3
我会坦诚地说:在 "grid.newpage()" 之后的代码我不太理解。因此,我一直在尝试理解代码组件实际执行的操作,但每次我认为我已经理解了它的工作原理时,又会有另一个挫折等着我。
R基本上给我一个箭头和盒子到处都是的图表,但并不是我想要的样子。然后有时我的盒子甚至太大或什么的?特别是图表末尾的两个子组的盒子经常被切断...
你有没有想法如何“强制”R为我复制那种图表(见图片)?
非常感谢您的帮助,这将使我更接近最终完成论文...!
提前致谢!


DiagrammeR包来完成这样的任务:https://datascienceplus.com/how-to-build-a-simple-flowchart-with-r-diagrammer-package/ - Ben