我正在做一个项目,需要创建一个预览nx.Graph()的功能,可以通过鼠标拖拽来改变节点的位置。我的当前代码能够在鼠标每次移动时立即重新绘制整个图形,但会显著增加延迟。我应该如何仅更新所需的艺术元素,也就是点击的节点、它的标签文本和相邻边缘,而不是刷新plt.subplots()的所有艺术元素?我能否至少得到需要重新定位的所有艺术元素的引用?
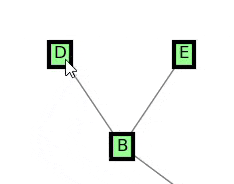
我从networkx中开始了显示图形的标准方式:
import networkx as nx
import matplotlib.pyplot as plt
import numpy as np
import scipy.spatial

def refresh(G):
    plt.axis((-4, 4, -1, 3))
    nx.draw_networkx_labels(G, pos = nx.get_node_attributes(G, 'pos'),
                                bbox = dict(fc="lightgreen", ec="black", boxstyle="square", lw=3))
    nx.draw_networkx_edges(G, pos = nx.get_node_attributes(G, 'pos'), width=1.0, alpha=0.5)
    plt.show()

nodes = np.array(['A', 'B', 'C', 'D', 'E', 'F', 'G'])
edges = np.array([['A', 'B'], ['A', 'C'], ['B', 'D'], ['B', 'E'], ['C', 'F'], ['C', 'G']])
pos = np.array([[0, 0], [-2, 1], [2, 1], [-3, 2], [-1, 2], [1, 2], [3, 2]])

G = nx.Graph()
# IG = InteractiveGraph(G) #>>>>> add this line in the next step
G.add_nodes_from(nodes)
G.add_edges_from(edges)
nx.set_node_attributes(G, dict(zip(G.nodes(), pos.astype(float))), 'pos')

fig, ax = plt.subplots()
# fig.canvas.mpl_connect('button_press_event', lambda event: IG.on_press(event))
# fig.canvas.mpl_connect('motion_notify_event', lambda event: IG.on_motion(event))
# fig.canvas.mpl_connect('button_release_event', lambda event: IG.on_release(event))
refresh(G) # >>>>> replace it with IG.refresh() in the next step
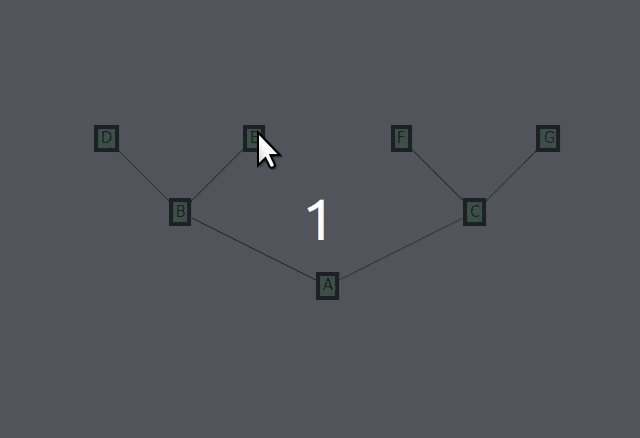
在下一步中,我更改了以前脚本的5行代码(取消注释4行并替换1行),并使用了
InteractiveGraph 实例使其变得交互式:class InteractiveGraph:
def __init__(self, G, node_pressed=None, xydata=None):
self.G = G
self.node_pressed = node_pressed
self.xydata = xydata
def refresh(self, show=True):
plt.clf()
nx.draw_networkx_labels(self.G, pos = nx.get_node_attributes(self.G, 'pos'),
bbox = dict(fc="lightgreen", ec="black", boxstyle="square", lw=3))
nx.draw_networkx_edges(self.G, pos = nx.get_node_attributes(self.G, 'pos'), width=1.0, alpha=0.5)
plt.axis('off')
plt.axis((-4, 4, -1, 3))
fig.patch.set_facecolor('white')
if show:
plt.show()
def on_press(self, event):
if event.inaxes is not None and len(self.G.nodes()) > 0:
nodelist, coords = zip(*nx.get_node_attributes(self.G, 'pos').items())
kdtree = scipy.spatial.KDTree(coords)
self.xydata = np.array([event.xdata, event.ydata])
close_idx = kdtree.query_ball_point(self.xydata, np.sqrt(0.1))
i = close_idx[0]
self.node_pressed = nodelist[i]
def on_motion(self, event):
if event.inaxes is not None and self.node_pressed:
new_xydata = np.array([event.xdata, event.ydata])
self.xydata += new_xydata - self.xydata
#print(d_xy, self.G.nodes[self.node_pressed])
self.G.nodes[self.node_pressed]['pos'] = self.xydata
self.refresh(show=False)
event.canvas.draw()
def on_release(self, event):
self.node_pressed = None
相关资源:
set_data方法来更新特定的元素,这将大大提高性能。 - Ianhi