假设我在图表上有3组每组3个点,我需要一份黑白版的图表,在该图表中,这3组的3个点都用不同的符号表示。 我应该如何指定panel.superpose函数?
http://www.r-bloggers.com/working-with-themes-in-lattice-graphics/ http://stat.ethz.ch/R-manual/R-devel/library/lattice/html/panel.superpose.html
假设我在图表上有3组每组3个点,我需要一份黑白版的图表,在该图表中,这3组的3个点都用不同的符号表示。 我应该如何指定panel.superpose函数?
http://www.r-bloggers.com/working-with-themes-in-lattice-graphics/ http://stat.ethz.ch/R-manual/R-devel/library/lattice/html/panel.superpose.html
我倾向于使用你提供的博客文章中概述的相同的一般策略。
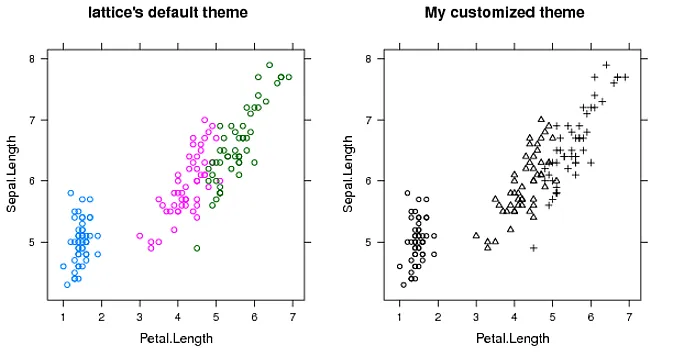
从 standard.theme() 开始,您可以进行设置调整,直到获得最适合自己需求的定制主题。一旦您得到一个喜欢的东西,只需通过 par.settings 参数将其插入到想要使用它的任何地方即可。
library(lattice)
# Start work on your own black-and-white theme
myTheme <- standard.theme(col = FALSE)
myTheme$superpose.symbol$pch <-1:7

# These are the kinds of commands you can use to explore the list of available
# settings as well as their current settings.
names(myTheme)
myTheme$superpose.symbol

# Compare the results of your own theme to those produce by lattice's
# default settings.
library(gridExtra)
p1 <- xyplot(Sepal.Length ~ Petal.Length, group= Species, data = iris,
             main = "lattice's default theme")
p2 <- xyplot(Sepal.Length ~ Petal.Length, group= Species, data = iris,
             par.settings = myTheme,
             main = "My customized theme")
grid.arrange(p1, p2, ncol=2)
可能有更简单的方法(我对格子不是很熟悉),但是:
library(lattice)
df <- data.frame(x = rnorm(9), y = rnorm(9), z= letters[1:3])

xyplot(x~y,data=df,groups=z,
       par.settings=list(superpose.symbol=list(pch=1:3,
                                               col='black')))
这里有另一个解决方案,基于你在问题中提到的panel.superpose:
library(lattice)
xyplot(Sepal.Length ~ Petal.Length, groups = Species, data = iris,
panel = function(x,y,...){
    panel.superpose(x,y,..., pch=list("A","O","X"))
})
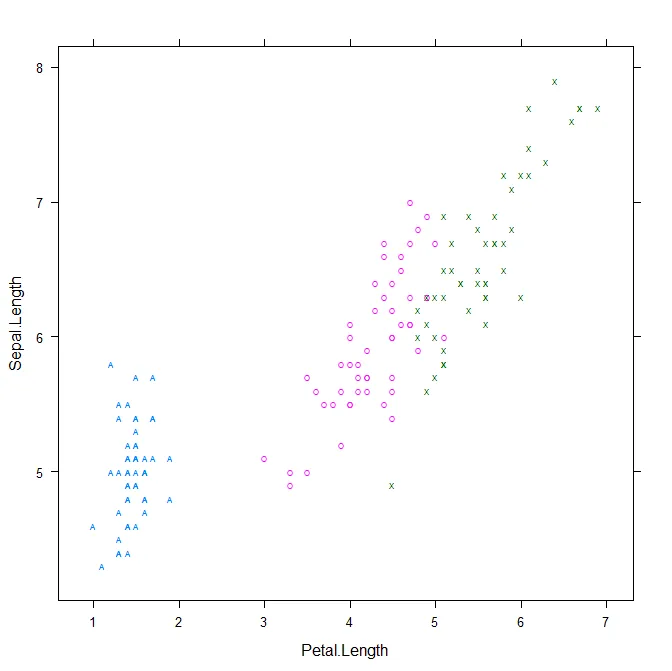
lattice使用主要变量(定义主显示),调节变量(定义不同面板中并置的子组)和分组变量(定义在面板内叠加的子组)。panel。如果groups!= NULL,则panel.superpose将分配给pch列表的第i个元素传递到groups的第i个级别。...为panel和panel.superpose可以避免定义所有函数参数,并仅声明要自定义的那些。
pars.settings附加自定义设置到特定对象,而lattice.options则全局影响设置。
ggplot2包。 - Justin