在一页上打印多种类型的图表

3

我想在同一页上绘制多个图形。我知道像gridExtra::grid.arrange这样的函数可以绘制由ggplot2包生成的图形。但是我遇到的问题是,我有两个图形(下面的bar.plotdensity.plot),它们由ggplot2包生成,并且还有一个使用limma::vennDiagram函数生成的图形。我已经尝试了以下代码,但没有成功:

output <- paste('summary.pdf')
pdf(output,width = 25,height = 20)
par(mfrow = c(3, 3))
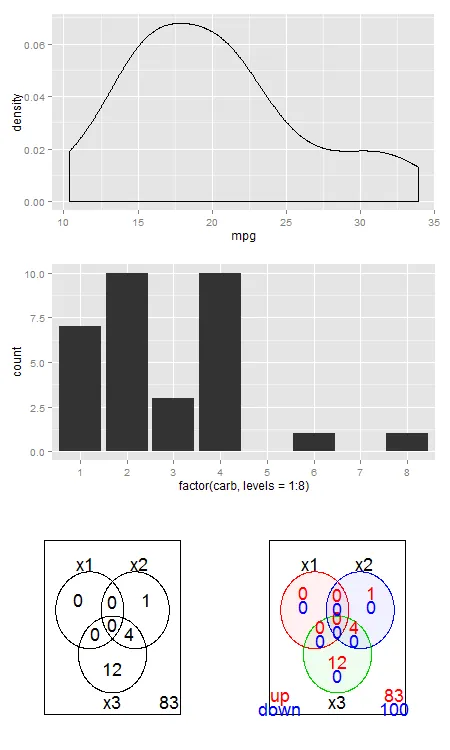
plot(bar.plot)
plot(density.plot)
print(vennDiagram(dat.venn, circle.col = col,cex = c(3,3,3)))
invisible(dev.off())

dat.venn是VennCounts类型的数据:

 I-H-10003-T1-D1 I-H-10003-T2-D1 I-H-10003-T3-D1 Counts
               0               0               0      0
               0               0               1     41
               0               1               0     81
               0               1               1     66
               1               0               0     10
               1               0               1      2
               1               1               0      4
               1               1               1     56
attr(,"class")
[1] "VennCounts"

我找不到与grid.arrange函数兼容的维恩图包。我认为VennCounts无法通过grid.arrange函数打印出来,而ggplot2图可以使用par函数打印。

更新: 我尝试使用pushViewport,但仍然将维恩图打印在下一页:

pdf(output,width = 25,height = 20)

# Create layout : nrow = 2, ncol = 2
pushViewport(viewport(layout = grid.layout(2, 2)))

# A helper function to define a region on the layout
define_region <- function(row, col){
  viewport(layout.pos.row = row, layout.pos.col = col)
} 

# Arrange the plots
print(bar.plot, vp = define_region(1, 1:2))
print(density.plot, vp = define_region(2, 1))
print(vennDiagram(dat.venn, circle.col = col,cex = c(3,3,3)), vp = define_region(2, 2))
dev.off()

任何帮助都将不胜感激!

1
https://cran.r-project.org/web/packages/gridBase/vignettes/gridBase.pdf - Roland
1
我没有看到你在那里使用gridBase包中的函数。 - Roland
你给我的链接是gridBase的手册。我看到有一些建议使用pushViewport,所以我用了它。 - Komal Rathi
这些建议更具体。 - Roland
1
需要将多种类型图形(基于网格,以及其他如Excel、plotrix等)结合起来时,我将它们都保存为 .png 文件,使用 grid 包的 readPNG 函数加载它们,然后使用 rasterGrob 函数进行转换。 一旦所有的绘图格式相同,grid.arrange() 就能派上用场了。 - lawyeR
显示剩余2条评论
2个回答

3

首先,将每个文件保存为.png格式,例如save(yourfile, file = "yourname.png")

其次,使用grid包的readPNG函数加载它们,例如yours.png <- readPNG("yourfile.PNG")

之后,使用rasterGrob函数将它们转换为g1 <- rasterGrob(yours.png, interpolate=TRUE)

一旦所有图形都以相同的格式进行比较,grid.arrange()就可以解决问题。它可能看起来像这样:

grid.arrange(g1, g2, g3, nrow=1)  # one row
dev.copy(png,'threeplots.png')   # to save the array of plots     
dev.off()                         # to close the device

2
gridGraphics包与gridBase类似,使得混合使用grid、ggplot、lattice和基本图形变得相当简单。 grid.echo()函数将基本图形转换为grid图形。(使用gridGraphics的优点是基本图形可以通过grid进行编辑和修改;请参阅gridGraphics.pdf。)
在下面的示例中,我绘制了两个ggplots和一个venn图(从limma包中的vennDiagram帮助页面中获取),并将三个图形放置在视口中,确保venn图形受到grid.echo处理。 更新至ggplot2 2.0.0 (默认geom_barstatstat = "count"
  library(ggplot2)
  library(gridGraphics)
  library(grid)
  library(limma)  # From bioC software repository

  grid.newpage()

  # Position 1st ggplot
  pushViewport(viewport(y = 1, height = 1/3, just = "top"))
  gg1 <- ggplot(mtcars, aes(x = mpg)) + geom_density()  
  print(gg1, newpage = FALSE)
  upViewport()

  # Position 2nd ggplot
  pushViewport(viewport(y = .5, height = 1/3, just = "centre"))
  gg2 <- ggplot(mtcars, aes(x = factor(carb, levels = 1:8))) + 
          geom_bar() + scale_x_discrete(drop = FALSE)
  print(gg2, newpage = FALSE)
  upViewport()

  # Function to draw venn diagram - the venn diagram is taken from ?vennDiagram
  plotfun <- function() {   
   Y <- matrix(rnorm(100*6),100,6)
   Y[1:10,3:4] <- Y[1:10,3:4]+3
   Y[1:20,5:6] <- Y[1:20,5:6]+3
   design <- cbind(1,c(0,0,1,1,0,0),c(0,0,0,0,1,1))
   fit <- eBayes(lmFit(Y,design))
   results <- decideTests(fit)
   a <- vennCounts(results)
   print(a)
   mfrow.old <- par()$mfrow
   par(mfrow=c(1,2))
   vennDiagram(a)
   vennDiagram(results, 
       include=c("up", "down"),
       counts.col=c("red", "blue"),
       circle.col = c("red", "blue", "green3"))
  }

  # Position the venn diagram
  pushViewport(viewport(y = 0, height = 1/3, just = "bottom"))
  grid.echo(plotfun, newpage = FALSE)
  upViewport(0)

enter image description here


网页内容由stack overflow 提供, 点击上面的
可以查看英文原文,
原文链接