有没有一种方法可以从关联矩阵绘制图形。 所谓的图形是指数学中的http://en.wikipedia.org/wiki/Graph_(mathematics),而不是一个绘图。
到目前为止,我只找到了如何将关联矩阵转换为邻接矩阵的方法。
在R中,使用igraph库可以实现。那么在matlab中有没有简单的方法呢?
有没有一种方法可以从关联矩阵绘制图形。 所谓的图形是指数学中的http://en.wikipedia.org/wiki/Graph_(mathematics),而不是一个绘图。
到目前为止,我只找到了如何将关联矩阵转换为邻接矩阵的方法。
在R中,使用igraph库可以实现。那么在matlab中有没有简单的方法呢?
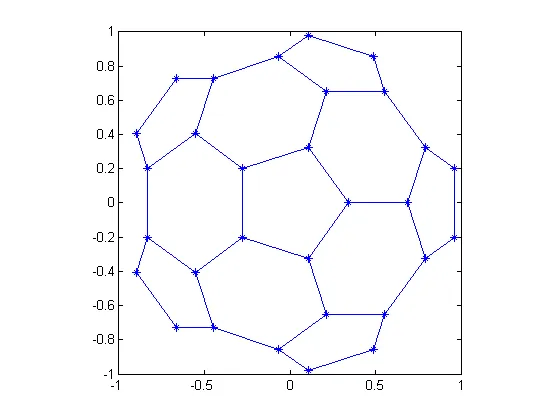
gplot:k = 1:30;
[B,XY] = bucky;
gplot(B(k,k),XY(k,:),'-*')
axis square
 http://www.mathworks.com/help/matlab/ref/gplot.html
编辑:
http://www.mathworks.com/help/matlab/ref/gplot.html
编辑:
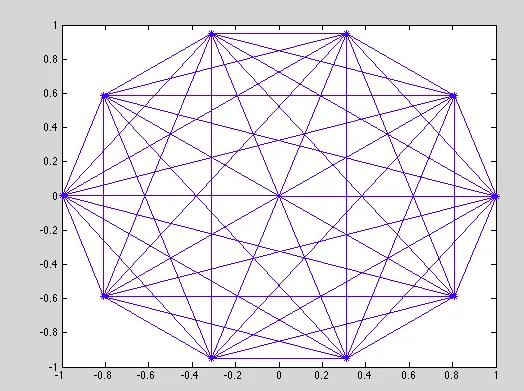
dt = 2*pi/10;
t = dt:dt:2*pi;
x = cos(t); y = sin(t);
A = ones(10);
gplot(A,[x' y']);
A = ones(3,3);
gplot(A,[x' y']);
a = [0 1 1; 1 0 0; 1 1 0];
gplot(a,[x' y'] ,'-*');
带箭头的图表
之前的回复都只涉及没有考虑图表是否为有向图。这意味着,如果存在一条边(i,j),则可能不存在边(j,i)。为了考虑这种情况,可以使用以下代码:
% This figure will be used to plot the structure of the graph represented
% by the current A matrix.
figure

dt = 2*pi/N_robots;
t = dt:dt:2*pi;
x = cos(t); y = sin(t);

agents=[       2    2.5;
               0.5  2.0;
               0.5  1.0;
               2.0  0.5;
               3.5  1.0;
               3.5  2.0;];

agents = p0;

agents = [x' y'];

% plot(agents(:,1),agents(:,2),'s','MarkerSize', 20, 'MarkerFaceColor', [1 0 1])
grid on
%xlim([0 4])
%ylim([0 3])
hold on
index=1;
% The following prints the non-directed graph corresponding to the A matrix
for i=1:N_robots
    for j=index:N_robots
        if A(i,j) == 1
            arrowline(agents([i j],1),agents([i j],2),'arrowsize',600);
%             plot(agents([i j],1),agents([i j],2),'--','LineWidth',2.5);
        end
    end
end
set(gca,'FontSize',fontsize2)

title('Structure of the Graph','interpreter', 'latex','FontSize', 18)
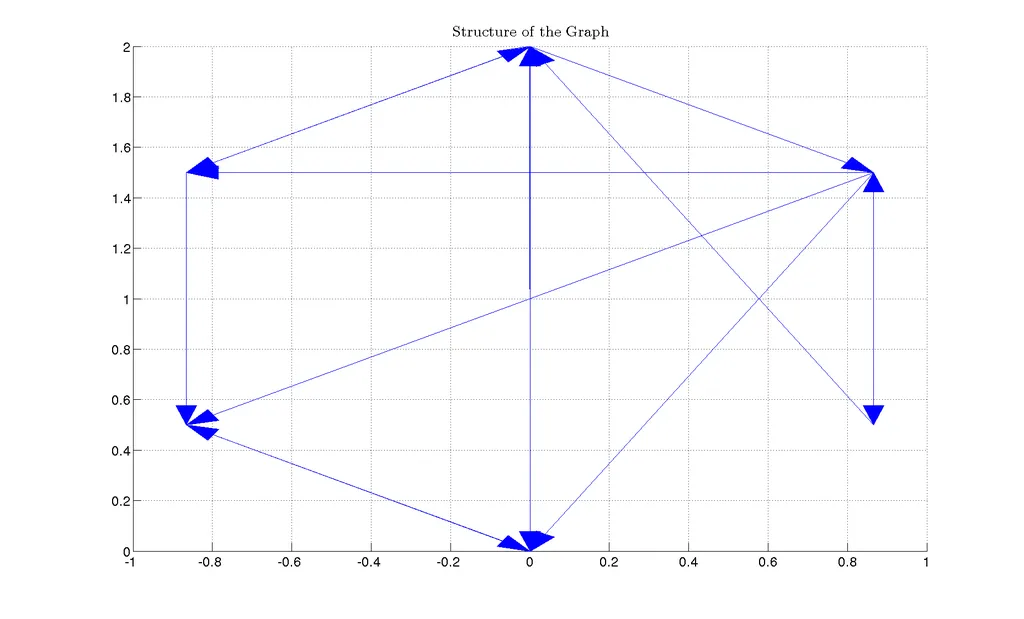 这对于目前6个代理肯定有效。我没有时间测试一般数量的代理,但原则上应该可以。你可以使用不同的代理向量来实现。
这里有一个解决方案,使用类似于您的a的矩阵
% Define a matrix A.
A = [0 1 1 0 ; 1 0 0 1 ; 1 0 0 1 ; 0 1 1 0];

% Draw a picture showing the connected nodes.
cla
subplot(1,2,1);
gplot(A,[0 1;1 1;0 0;1 0],'.-');
text([-0.2, 1.2 -0.2, 1.2],[1.2, 1.2, -.2, -.2],('1234')', ...
    'HorizontalAlignment','center')
axis([-1 2 -1 2],'off')

% Draw a picture showing the adjacency matrix.
subplot(1,2,2);
xtemp=repmat(1:4,1,4);
ytemp=reshape(repmat(1:4,4,1),16,1)';
text(xtemp-.5,ytemp-.5,char('0'+A(:)),'HorizontalAlignment','center');
line([.25 0 0 .25 NaN 3.75 4 4 3.75],[0 0 4 4 NaN 0 0 4 4])
axis off tight