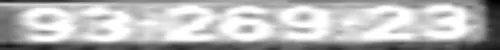
我需要知道如何使用Matlab清除图像中的噪声。让我们看一个例子:如上图所示,数字不够清晰。那么我该如何清除噪声和非数字像素,以便更容易地识别?谢谢。
清除图像中的噪声。
3
- Ofir A.
3
你的图片非常嘈杂。如果字体始终相同且已知,则可能会有很大优势。如果您有此字体,请发布一个图像,其中数字的比例尺与您已发布的图像相同,以查看是否足以启动。 - Dr. belisarius
@belisarius 谢谢,但我不明白你在这里说什么。是的,字体始终相同,但它如何帮助我呢? - Ofir A.
在相同比例尺下,使用与上面图像相同的字体发布包含所有数字的图片。 - Dr. belisarius
4个回答
23
让我们在Mathematica中逐步进行:
(*first separate the image in HSB channels*)
i1 = ColorSeparate[ColorNegate@yourColorImage, "HSB"]

(*Let's keep the B Channel*)
i2 = i1[[3]]
(*And Binarize it *)
i3 = Binarize[i2, 0.92]

(*Perform a Thinning to get the skeleton*)
i4 = Thinning[i3]

(*Now we cut those hairs*)
i5 = Pruning[i4, 10]

(*Remove the small lines*)
i6 = DeleteSmallComponents[i5, 30]

(*And finally dilate*)
i7 = Dilation[i6, 3]

(*Now we can perform an OCR*)
TextRecognize@i7
-->"93 269 23"
完成!
- Dr. belisarius
18
因为这个问题被标记为MATLAB,所以我将@belisarius的解决方案翻译如下(我认为它优于目前被接受的答案):
%# read image
I = imread('http://i.stack.imgur.com/nGNGf.png');

%# complement it, and convert to HSV colorspace
hsv = rgb2hsv(imcomplement(I));
I1 = hsv(:,:,3);                %# work with V channel

%# Binarize/threshold image
I2 = im2bw(I1, 0.92);

%# Perform morphological thinning to get the skeleton
I3 = bwmorph(I2, 'thin',Inf);

%# prune the skeleton (remove small branches at the endpoints)
I4 = bwmorph(I3, 'spur', 7);

%# Remove small components
I5 = bwareaopen(I4, 30);

%# dilate image
I6 = imdilate(I5, strel('square',2*3+1));

%# show step-by-step results
figure('Position',[200 150 700 700])
subplot(711), imshow(I)
subplot(712), imshow(I1)
subplot(713), imshow(I2)
subplot(714), imshow(I3)
subplot(715), imshow(I4)
subplot(716), imshow(I5)
subplot(717), imshow(I6)
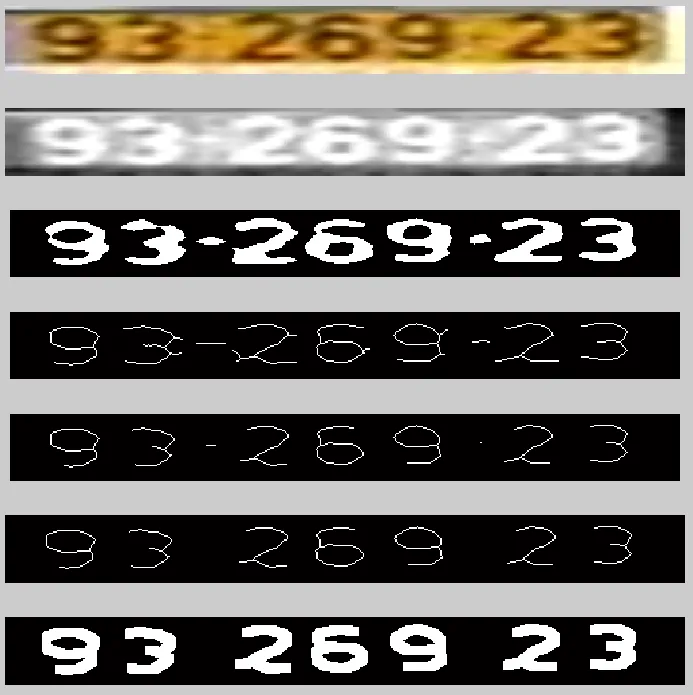
最后,您可以应用某种形式的OCR来识别这些数字。不幸的是,MATLAB中没有类似于Mathematica中的TextRecognize[]内置函数...与此同时,可以在文件交换中查找,我相信你会发现数十个填补这一空白的提交 :)
- Amro
3
你的解决方案很棒,但在其他情况下它并没有起作用,而Misha的解决方案确实有效。谢谢。 - Ofir A.
2@Michael:显然,在图像处理中,没有一种解决方案适用于所有情况。因此,您需要调整参数以适应您的特殊情况(例如二值阈值、膨胀大小等)。 - Amro
3@Michael,此外,也许更重要的是,当您发布一个图像处理问题时,您应该提供一组测试用例。这是其他人能够处理您的问题的唯一方式。 - Dr. belisarius
7
你是用双色(黑白)的二值图像开始的吗?还是自己进行了阈值处理?
如果是后者,你可能会发现在阈值处理之前进行噪声降低更容易。在这种情况下,请上传你在阈值处理之前所拥有的图像。
如果是前者,那么你将会遇到困难,因为传统的噪声降低方法并不适用。原因是许多噪声降低方法利用了噪声和实际自然图像之间统计特性的区别。通过阈值处理,这种区别基本上被破坏了。
编辑:
好吧,严格来说,你的图像并不是真正的嘈杂——它模糊(字母互相交错)并且有背景干扰。
但无论如何,这是我处理它的方式:
1.选择一个颜色通道进行操作(RGB是三个通道,通常一个足够)。我选择绿色,因为它看起来最容易操作。
2.模糊图像(我在GIMP中使用了5x5高斯核)。
3.使用经验确定的阈值进行阈值处理(基本上,尝试每个阈值,直到得到合理的结果)。如果一些数字有间隙也没关系——我们可以在下一步中关闭它们。
4.形态学图像处理(侵蚀和膨胀)。
绿色通道:
图片
模糊(5x5高斯):
图片
阈值化的图像(我在GIMP中使用了约93的阈值):
图片
最终结果:
图片
你可以看到中间的6和9之间的空隙已经消失了。不幸的是,我无法让左边的3的空隙消失——它太大了。以下是导致这些问题的原因:
1.图像顶部的线比3的某些部分要暗得多。如果你使用阈值来去除该线,则会创建一个间隙。如果你通过更激进的裁剪方法来去除那条线(例如),则阈值处理结果对于3而言将会好得多。
2.此外,中间的2和6正在合并。需要进行重度阈值处理才能防止它们在阈值处理后形成相同的斑点。
- mpenkov
5
@misha 谢谢您的回复。原始图像是RGB格式,我将其转换为黑白格式。如果我的图像仍然是RGB格式而不是黑白格式,这对我有何帮助呢?再次感谢。 - Ofir A.
如果您的原始图像是RGB格式,则可以进行诸如颜色通道操作和自适应中值滤波等操作,以减少噪声的影响。 如果您上传RGB图像,那么解释起来会更容易,请上传它并告诉我。 - mpenkov
@misha,非常感谢你的帮助。我现在正在工作,稍后我会发布RGB图像。我把它放在家里的电脑上。非常感谢。 - Ofir A.
@misha,我该如何选择要处理的颜色?以及我需要如何使用5x5高斯模糊图像?正如你所看到的,我的Matlab技能并不是很高,所以如果你能详细解释一下就太好了。无论如何,非常感谢你的帮助。 - Ofir A.
您可以通过视觉检查来选择颜色通道。绿色通常是一个安全的选择,因为当转换为灰度时它是占主导地位的(人眼对绿色最敏感)。至于高斯滤波,请尝试访问此链接:http://www.dsprelated.com/groups/matlab/show/2521.php - mpenkov
0
我认为有两件事情可以做来使它们更易于检测:
- 移除小于某个像素数量的补丁(这将消除数字集之间的斑点)
- 数字应该是“封闭”的形式,因此您需要一种算法来检测应更改为黑色的像素(在每个数字的顶部),以便“关闭”数字“形状”。
您还有线性特征是噪声信号的一部分,可以通过边缘/线检测进行检测。
检测连续的“区域”并计算诸如紧凑度或长度/高度等特征也可能有助于确定要保留哪些结构...
- Benjamin
2
我不是Matlab专家,如果您能更具体一些,我将不胜感激。请问应该使用哪个函数来删除小于某个像素数量的补丁。谢谢。 - Ofir A.
@michael 注意,删除小元素只能处理数字之间的点。其余的噪音是最大的问题,需要更多的思考。 - Dr. belisarius
网页内容由stack overflow 提供, 点击上面的可以查看英文原文,
原文链接
原文链接