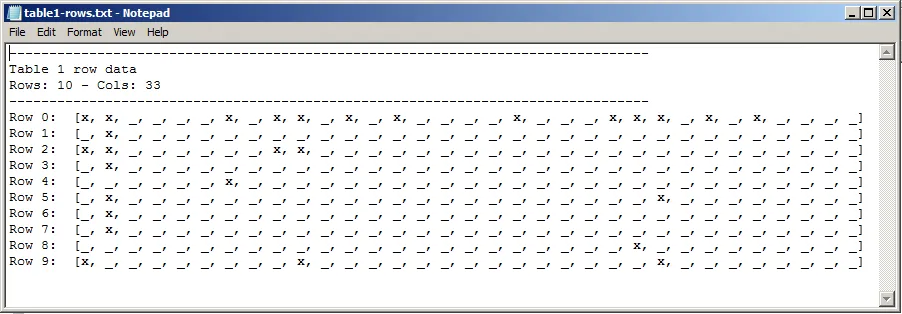
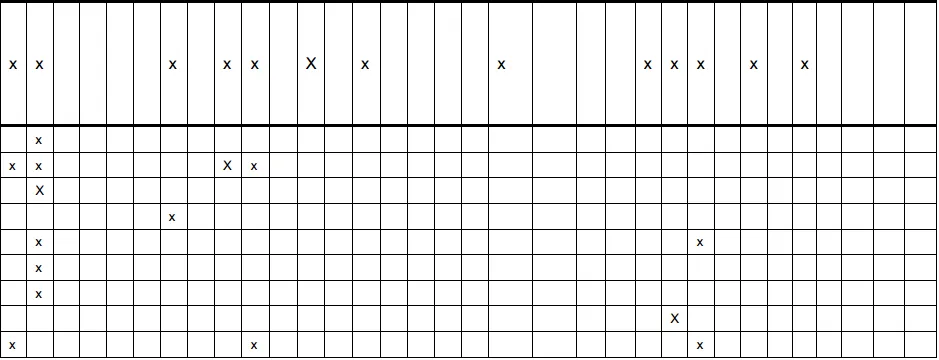
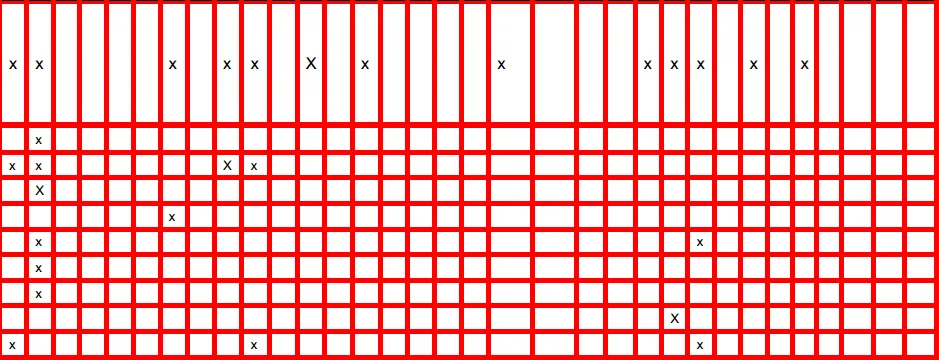
我有这张桌子的图片(如下所示)。我正在尝试获取与表格图像中的第一行类似的表格数据:
rows[0] = [x,x, , , , ,x, ,x,x, ,x, ,x, , , , ,x, , , ,x,x,x, ,x, ,x, , , , ]
我需要x的数量以及空格的数量,还会有其他类似于这个表格的图像(都有x和相同的列数)。
到目前为止,我能够使用x的图像检测出所有的x。 我也可以在一定程度上检测出线条。我正在使用Python中的open cv2。我还在使用houghTransform来检测水平和垂直线(这非常有效)。
我正在尝试找出如何逐行进行并将信息存储在列表中。
这些是训练图像:
用于检测x(代码中的train1.png)

用于检测线路(代码中的train2.png)

用于检测线路(代码中的train3.png)

这是我到目前为止的代码:
# process images
from pytesser import *
from PIL import Image
from matplotlib import pyplot as plt
import pytesseract
import numpy as np
import cv2
import math
import os
# the table images
images = ['table1.png', 'table2.png', 'table3.png', 'table4.png', 'table5.png']
# the template images used for training
templates = ['train1.png', 'train2.png', 'train3.png']
def hough_transform(im):
img = cv2.imread('imgs/'+im)
gray = cv2.cvtColor(img, cv2.COLOR_BGR2GRAY)
edges = cv2.Canny(gray, 50, 150, apertureSize=3)
lines = cv2.HoughLines(edges, 1, np.pi/180, 200)
i = 1
for rho, theta in lines[0]:
a = np.cos(theta)
b = np.sin(theta)
x0 = a*rho
y0 = b*rho
x1 = int(x0 + 1000*(-b))
y1 = int(y0 + 1000*(a))
x2 = int(x0 - 1000*(-b))
y2 = int(y0 - 1000*(a))
#print '%s - 0:(%s,%s) 1:(%s,%s), 2:(%s,%s)' % (i,x0,y0,x1,y1,x2,y2)
cv2.line(img, (x1,y1), (x2,y2), (0,0,255), 2)
i += 1
fn = os.path.splitext(im)[0]+'-lines'
cv2.imwrite('imgs/'+fn+'.png', img)
def match_exes(im, te):
img_rgb = cv2.imread('imgs/'+im)
img_gry = cv2.cvtColor(img_rgb, cv2.COLOR_BGR2GRAY)
template = cv2.imread('imgs/'+te, 0)
w, h = template.shape[::-1]
res = cv2.matchTemplate(img_gry, template, cv2.TM_CCOEFF_NORMED)
threshold = 0.71
loc = np.where(res >= threshold)
pts = []
exes = []
blanks = []
for pt in zip(*loc[::-1]):
pts.append(pt)
cv2.rectangle(img_rgb, pt, (pt[0]+w, pt[1]+h), (0,0,255), 1)
fn = os.path.splitext(im)[0]+'-exes'
cv2.imwrite('imgs/'+fn+'.png', img_rgb)
return pts, exes, blanks
def match_horizontal_lines(im, te, te2):
img_rgb = cv2.imread('imgs/'+im)
img_gry = cv2.cvtColor(img_rgb, cv2.COLOR_BGR2GRAY)
template = cv2.imread('imgs/'+te, 0)
w1, h1 = template.shape[::-1]
template2 = cv2.imread('imgs/'+te2, 0)
w2, h2 = template2.shape[::-1]
# first line template (the downward facing line)
res1 = cv2.matchTemplate(img_gry, template, cv2.TM_CCOEFF_NORMED)
threshold1 = 0.8
loc1 = np.where(res1 >= threshold1)
# second line template (the upward facing line)
res2 = cv2.matchTemplate(img_gry, template2, cv2.TM_CCOEFF_NORMED)
threshold2 = 0.8
loc2 = np.where(res2 >= threshold2)
pts = []
exes = []
blanks = []
# find first line template (the downward facing line)
for pt in zip(*loc1[::-1]):
pts.append(pt)
cv2.rectangle(img_rgb, pt, (pt[0]+w1, pt[1]+h1), (0,0,255), 1)
# find second line template (the upward facing line)
for pt in zip(*loc2[::-1]):
pts.append(pt)
cv2.rectangle(img_rgb, pt, (pt[0]+w2, pt[0]+h2), (0,0,255), 1)
fn = os.path.splitext(im)[0]+'-horiz'
cv2.imwrite('imgs/'+fn+'.png', img_rgb)
return pts, exes, blanks
# process
text = ''
for img in images:
print 'processing %s' % img
hough_transform(img)
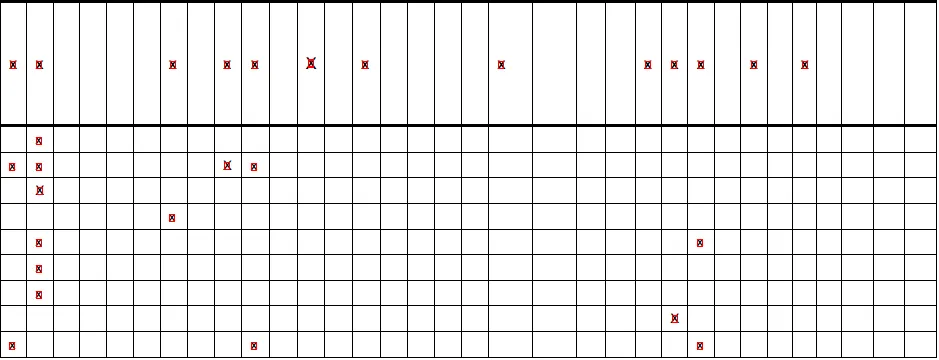
pts, exes, blanks = match_exes(img, templates[0])
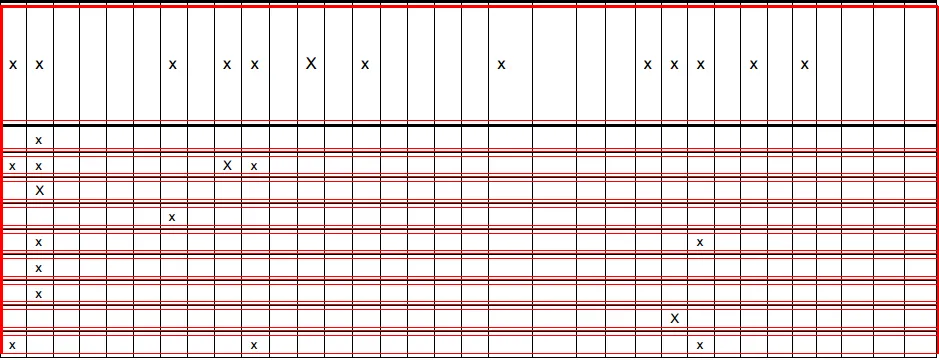
pts1, exes1, blanks1 = match_horizontal_lines(img, templates[1], templates[2])
text += '%s: %s x\'s & %s horizontal lines\n' % (img, len(pts), len(pts1))
# statistics file
outputFile = open('counts.txt', 'w')
outputFile.write(text)
outputFile.close()
而且,输出的图像看起来像这样(您可以看到,所有的x都被检测到了,但不是所有的线):
x's
水平线:
霍夫变换:
就像我说的那样,我实际上只是想从表格中获取数据,类似于这种形式(表格图像的第一行):
row a = [x,x, , , , ,x, ,x,x, ,x, ,x, , , , ,x, , , ,x,x,x, ,x, ,x, , , , ]
我需要x的数量以及空格的数量。还会有其他类似于这个表格的图片(所有表格都有相同数量的列和不同数量的行且都有x)。
另外,我正在使用Python 2.7。