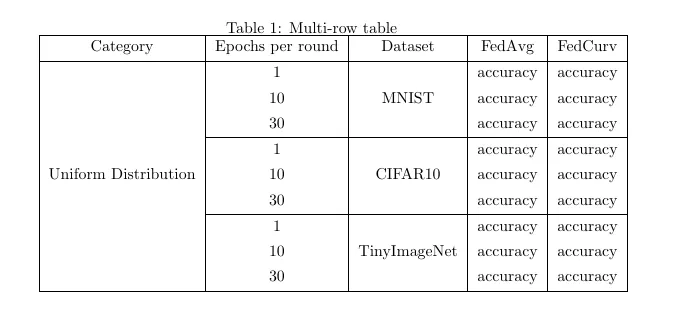
我用Latex创建了这个表格:
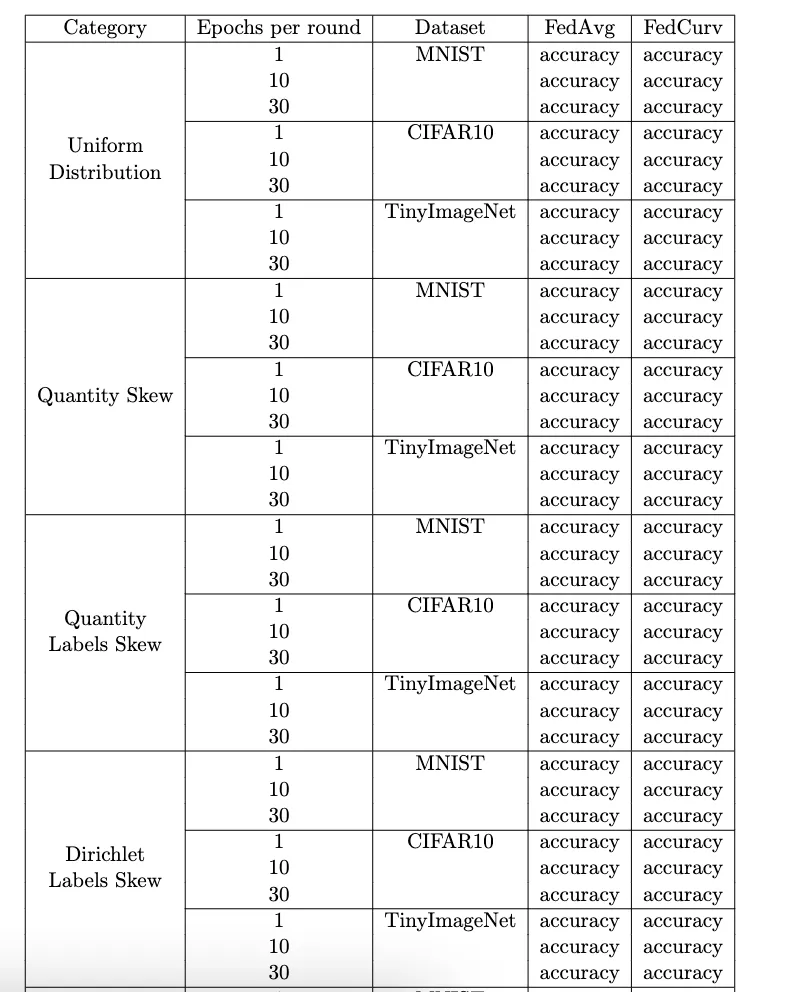 您可以看到数据集一列中的文字(MNIST,CIFAR10等)没有垂直对齐。我该如何将这些字符串放置在单元格的中间?
这是我的代码:
您可以看到数据集一列中的文字(MNIST,CIFAR10等)没有垂直对齐。我该如何将这些字符串放置在单元格的中间?
这是我的代码:
您可以看到数据集一列中的文字(MNIST,CIFAR10等)没有垂直对齐。我该如何将这些字符串放置在单元格的中间?
这是我的代码:\begin{table}[!hbt]
\caption{Multi-row table}
\begin{center}
\begin{tabular}{|c|c|c|c|c|}
\hline
Category & Epochs per round & Dataset & FedAvg & FedCurv \\
\hline
\multirow{9}{2.5cm}{\centering Uniform Distribution} & 1 & MNIST & accuracy & accuracy \\
& 10 & & accuracy & accuracy \\
& 30 & & accuracy & accuracy \\ \cline{2-5}
& 1 & CIFAR10 & accuracy & accuracy\\
& 10 & & accuracy & accuracy\\
& 30 & & accuracy & accuracy \\\cline{2-5}
& 1 & TinyImageNet & accuracy & accuracy \\
& 10 & & accuracy & accuracy \\
& 30 & & accuracy & accuracy \\
\hline
\multirow{9}{2.5cm}{\centering Quantity Skew} & 1 & MNIST & accuracy & accuracy \\
& 10 & & accuracy & accuracy \\
& 30 & & accuracy & accuracy \\ \cline{2-5}
& 1 & CIFAR10 & accuracy & accuracy\\
& 10 & & accuracy & accuracy\\
& 30 & & accuracy & accuracy \\ \cline{2-5}
& 1 & TinyImageNet & accuracy & accuracy \\
& 10 & & accuracy & accuracy\\
& 30 & & accuracy & accuracy \\
\hline
\multirow{9}{2.5cm}{\centering Quantity Labels Skew} & 1 & MNIST & accuracy & accuracy \\
...
\multirow{9}{2.5cm}{\centering Covariate Shift} & 1 & MNIST & accuracy & accuracy \\
& 10 & & accuracy & accuracy \\
& 30 & & accuracy & accuracy \\ \cline{2-5}
& 1 & CIFAR10 & accuracy & accuracy\\
& 10 & & accuracy & accuracy\\
& 30 & & accuracy & accuracy \\ \cline{2-5}
& 1 & TinyImageNet & accuracy & accuracy \\
& 10 & & accuracy & accuracy\\
& 30 & & accuracy & accuracy \\
\hline
\end{tabular}
\end{center}
\label{tab:multicol}
\end{table}