使用beside=TRUE参数时出现R错误

4
我正在使用
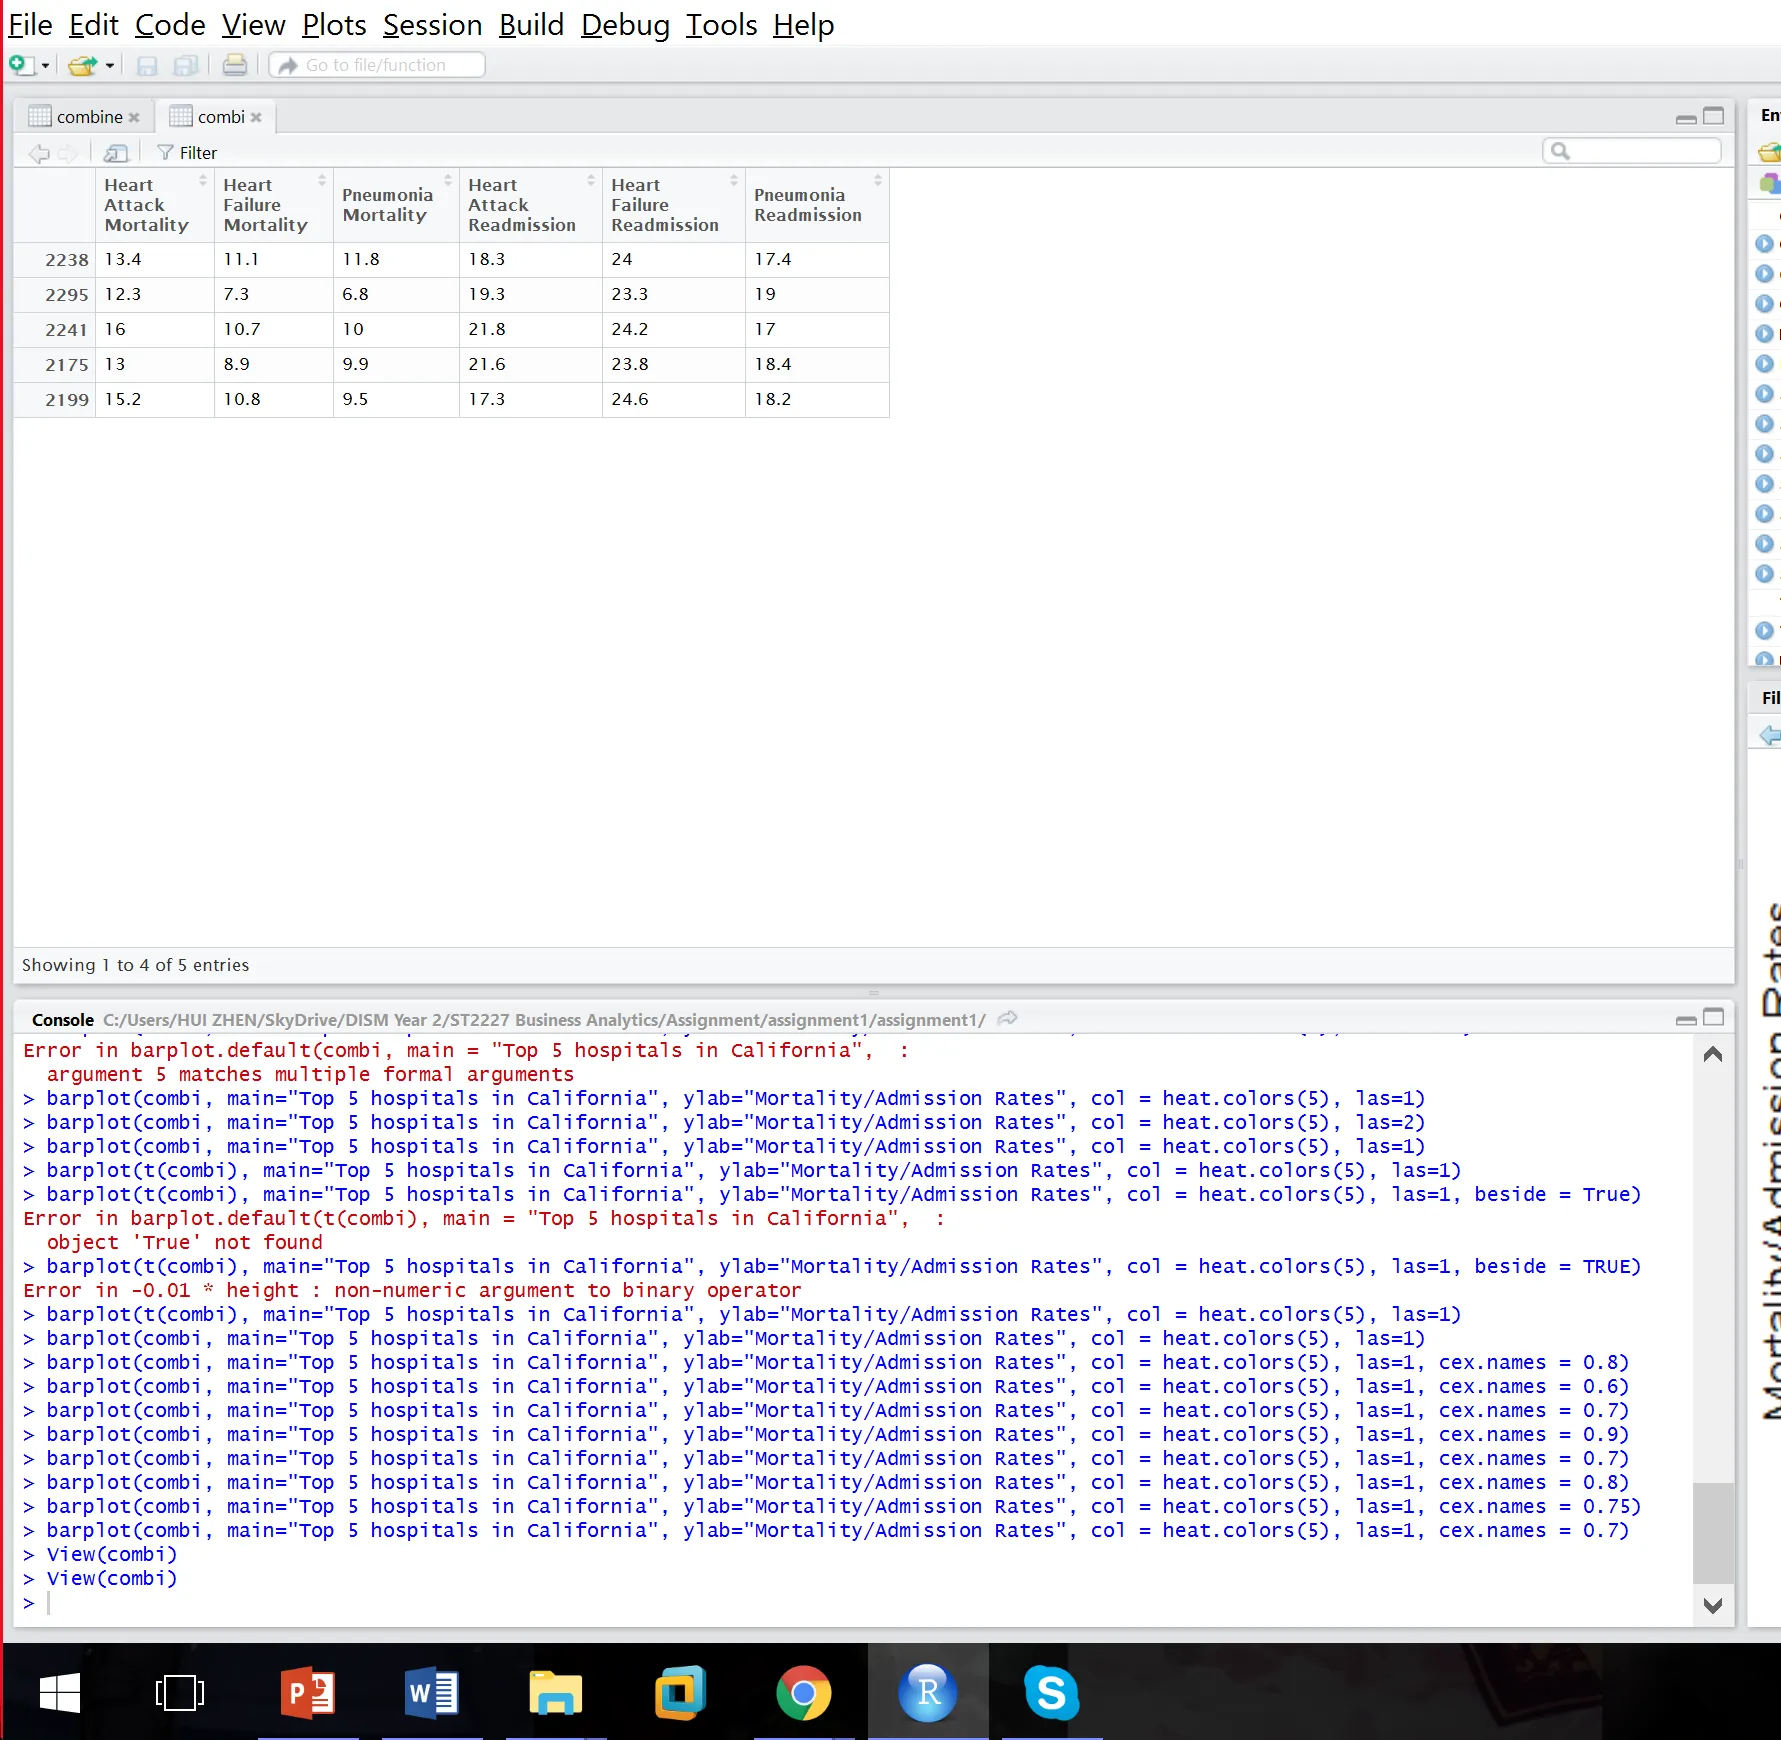
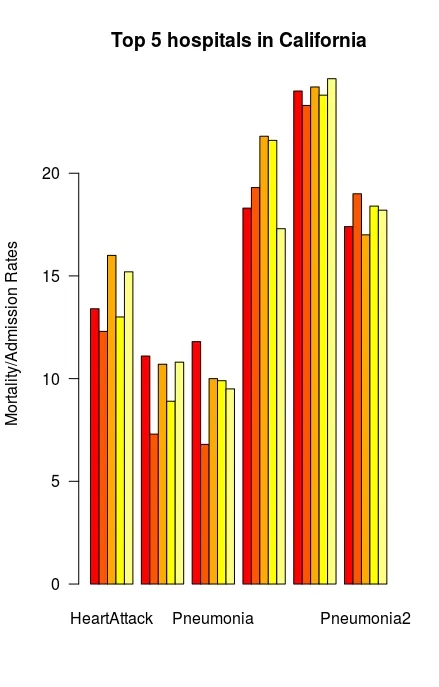
barplot()绘制图表,但是尝试使用beside=TRUE参数似乎会返回错误:Error in -0.01 * height : 非数字参数 以下是图表的代码:
combi <- as.matrix(combine)

barplot(combi, main="Top 5 hospitals in California", 
ylab="Mortality/Admission Rates", col = heat.colors(5), las=1)

图表的输出结果是条形图是叠在一起而不是并排显示。

enter image description here

enter image description here


奇怪,只有当
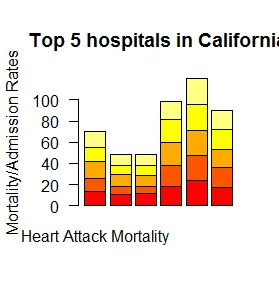
combi不是矩阵时才会出现这个错误,请参见此处:http://stackoverflow.com/questions/14909665/barplot-not-working - Tim Biegeleisen
@TimBiegeleisen 我尝试使用t()来更改组合,但是每当我添加beside=TRUE参数时它都无法工作。 - Kode.Error404
你能给我们展示一下你的数据集“combine”吗? - J_F
@J_F 请检查已编辑的帖子 - Kode.Error404
combine 是一个数据框时,你的问题无法重现。我已经使用你的数据进行了测试。你能检查一下 is(combine)is(combi) 吗? - J_F
显示剩余3条评论
2个回答

4

combine是一个数据框时,问题无法再现:

combine <- data.frame(
  HeartAttack = c(13.4,12.3,16,13,15.2),
  HeartFailure = c(11.1,7.3,10.7,8.9,10.8),
  Pneumonia = c(11.8,6.8,10,9.9,9.5),
  HeartAttack2 = c(18.3,19.3,21.8,21.6,17.3),
  HeartFailure2 = c(24,23.3,24.2,23.8,24.6),
  Pneumonia2 = c(17.4,19,17,18.4,18.2)
  )

combi <- as.matrix(combine)

barplot(combi, main="Top 5 hospitals in California", 
    ylab="Mortality/Admission Rates", col = heat.colors(5), las=1, beside = TRUE)

enter image description here


如果我需要添加图例,是否可以减少图例图标和文本之间的间距? - Kode.Error404

0

之前遇到过同样的问题(尽管是不同的数据集),并通过在将其转换为矩阵后使用as.numeric()在我的数据框上解决了它。不使用as as.numeric()会导致"Error in -0.01 * height : non-numeric argument to binary operator"

¯\(ツ)

我的数据框称为tmp:

> tmp
          125  1245 1252 1254 1525 1545 12125 12425 12525 12545 125245 125425
Freq.x.2d "14" " 1" " 1" " 1" " 3" " 2" " 1"  " 1"  " 9"  " 4"  " 1"   " 5"
Freq.x.3d "13" " 0" " 1" " 0" " 4" " 0" " 0"  " 0"  "14"  " 4"  " 1"   " 2"
> dim(tmp)
[1]  2 28
> is(tmp)
[1] "matrix"    "array"     "structure" "vector"

> tmp <- as.matrix(tmp)
> dim(tmp)
[1]  2 28
> is(tmp)
[1] "matrix"    "array"     "structure" "vector"

> tmp <- as.numeric(tmp)
> dim(tmp)
NULL
> is(tmp)
[1] "numeric" "vector"

barplot(tmp, las=2, beside=TRUE, col=c("grey40","grey80"))

网页内容由stack overflow 提供, 点击上面的
可以查看英文原文,
原文链接