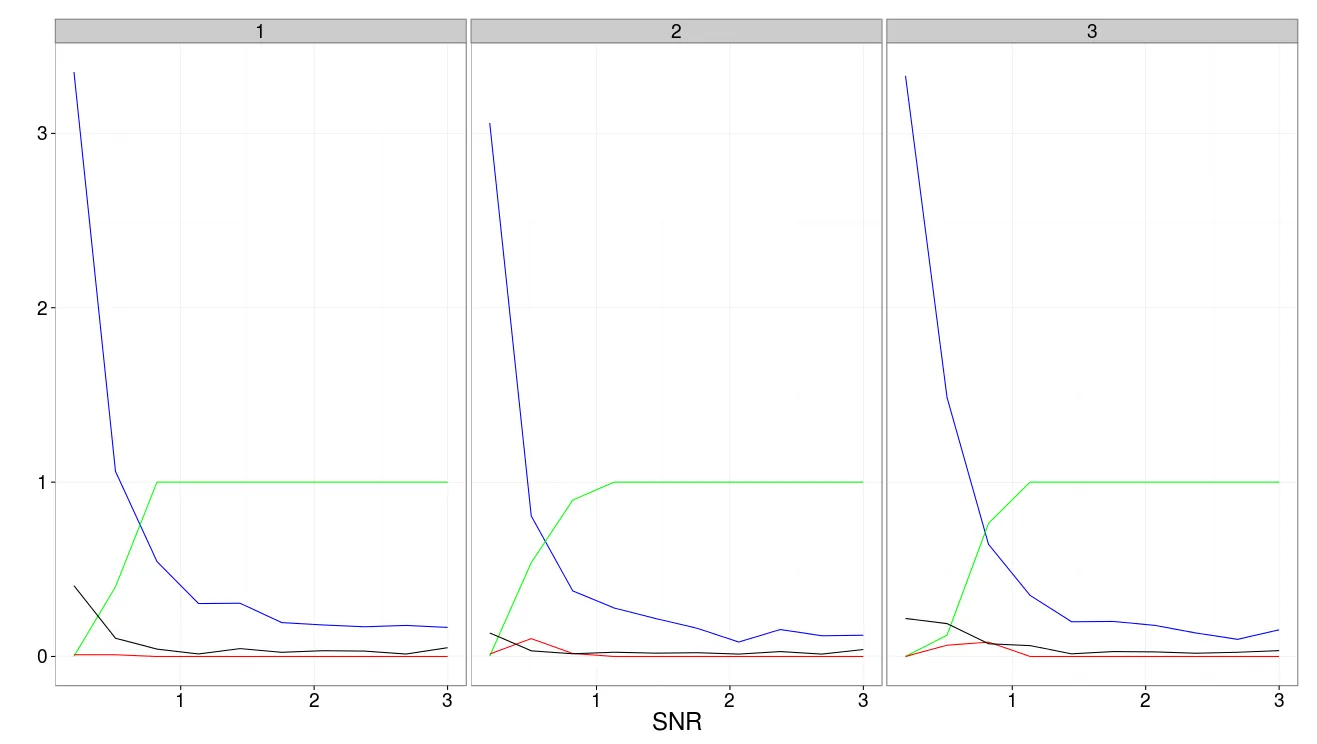
ggplot黑白配色

3

我有一个使用ggplot2生成的图表

ggplot()+geom_line(data=results,aes(x=SNR,y=MeanLambdaMin,group=rep),col="blue")+
  geom_line(data=results,aes(x=SNR,y=MeanA,group=rep),col="green")+
geom_line(data=results,aes(x=SNR,y=VarA,group=rep),col="red")+
  geom_line(data=results,aes(x=SNR,y=VarB,group=rep),col="black")+
facet_wrap(~ rep, as.table=T)+xlab("SNR")+ylab("")

结果很好 enter image description here 
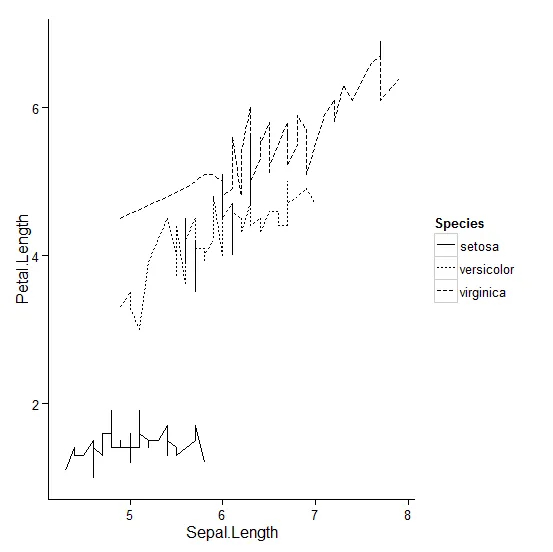
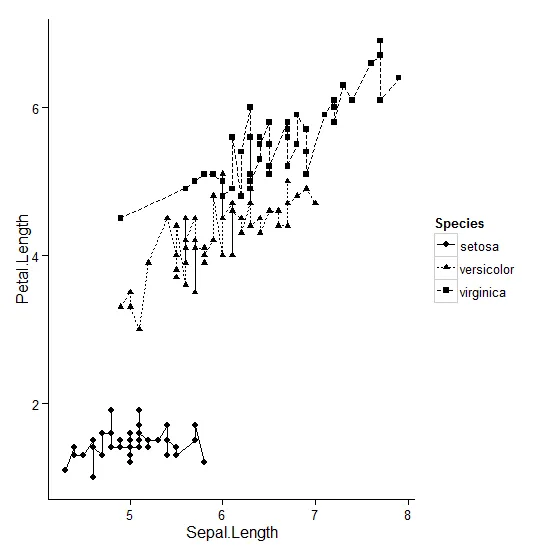
不太可能我必须以黑白方式打印它。 有什么最好的方法吗? 是否有任何选项可以针对黑白版本进行颜色优化?
这里有一个可重现的例子。
results=data.frame("SNR"=1:30)
results$MeanA=results$SNR^2
results$VarA=results$SNR*2
results$VarB=results$SNR^(1/2)
results$MeanLambdaMin=1:30
results$rep=sample(x=1:3,size=30,replace=T)

ggplot()+geom_line(data=results,aes(x=SNR,y=MeanLambdaMin,group=rep),col="blue")+
  geom_line(data=results,aes(x=SNR,y=MeanA,group=rep),col="green")+
geom_line(data=results,aes(x=SNR,y=VarA,group=rep),col="red")+
  geom_line(data=results,aes(x=SNR,y=VarB,group=rep),col="black")+
facet_wrap(~ rep, as.table=T)+xlab("SNR")+ylab("")

3
你能提供一个可重现的例子吗?你应该将颜色、线型和点型映射到一个变量,并通过美学调用它。 - Roman Luštrik
使用灰度黑白缩放 - Sander Van der Zeeuw
请你写代码好吗?我不是ggplot2的专家。 - Donbeo
@Donbeo 你被要求提供可重现的示例,但是你却提出问题而没有添加可重现的示例。我猜你可能不知道这是什么意思。这里有关于如何做的信息。基本上,如果我们没有数据来运行程序,那么帮助会更加困难,理解解决方案也更加困难。 - Tyler Rinker
2个回答

7
你的y值应该在一个与变量Species对应的变量中。例如:

更改线型:

ggplot(iris)  + 
  geom_line(aes(Sepal.Length,Petal.Length,linetype=Species)) +
  theme_classic()

图片描述

或者

更改点的线型和形状:

ggplot(iris)  + 
  geom_line(aes(Sepal.Length,Petal.Length,linetype=Species)) + 
  geom_point(aes(Sepal.Length,Petal.Length,shape=Species)) +
  theme_classic()

enter image description here


+1 - 你还可以改变线宽(如果你想突出显示某一行),只有3个灰度也不难构建三个明显不同的灰度。添加点可以增加面积,以区分灰度上的不同颜色。 - Andy W

0
ggplot() +
  geom_line(data=results,aes(x=SNR,y=MeanLambdaMin,group=rep),col="grey0") +
  geom_line(data=results,aes(x=SNR,y=MeanA,group=rep),col="grey20") +
  geom_line(data=results,aes(x=SNR,y=VarA,group=rep),col="grey40") +
  geom_line(data=results,aes(x=SNR,y=VarB,group=rep),col="grey80") + 
  facet_wrap(~ rep, as.table=T) +
  xlab("SNR") +
  ylab("")

现在你可以调整黑白缩放的差异了 :) 尝试不同的颜色组合。你可以输入“colours()”来查看所有颜色。

此外,你还可以在绘图代码末尾添加 + theme_grey()


2
如果您按照ggplot2的预期使用方式,即使用长格式的数据框,那么图例将会默认生成。请参见其他答案。 - Roland
@Donbeo 尝试使用 +legend()。 - Sander Van der Zeeuw

网页内容由stack overflow 提供, 点击上面的
可以查看英文原文,
原文链接