这是一组带有(x, y)坐标和0或1类别的临时点集。
tmp <- structure(list(cx = c(146.60916, 140.31737, 145.92917, 167.57799,
166.77618, 137.64381, 172.12157, 175.32881, 175.06154, 135.50566,
177.46696, 148.06731), cy = c(186.29814, 180.55231, 210.6084,
210.34111, 185.48505, 218.89375, 219.69554, 180.67421, 188.15775,
209.27205, 209.27203, 178.00151), category = c(1, 0, 1, 1, 1,
0, 0, 0, 0, 0, 0, 0)), class = "data.frame", row.names = c(NA,
-12L))
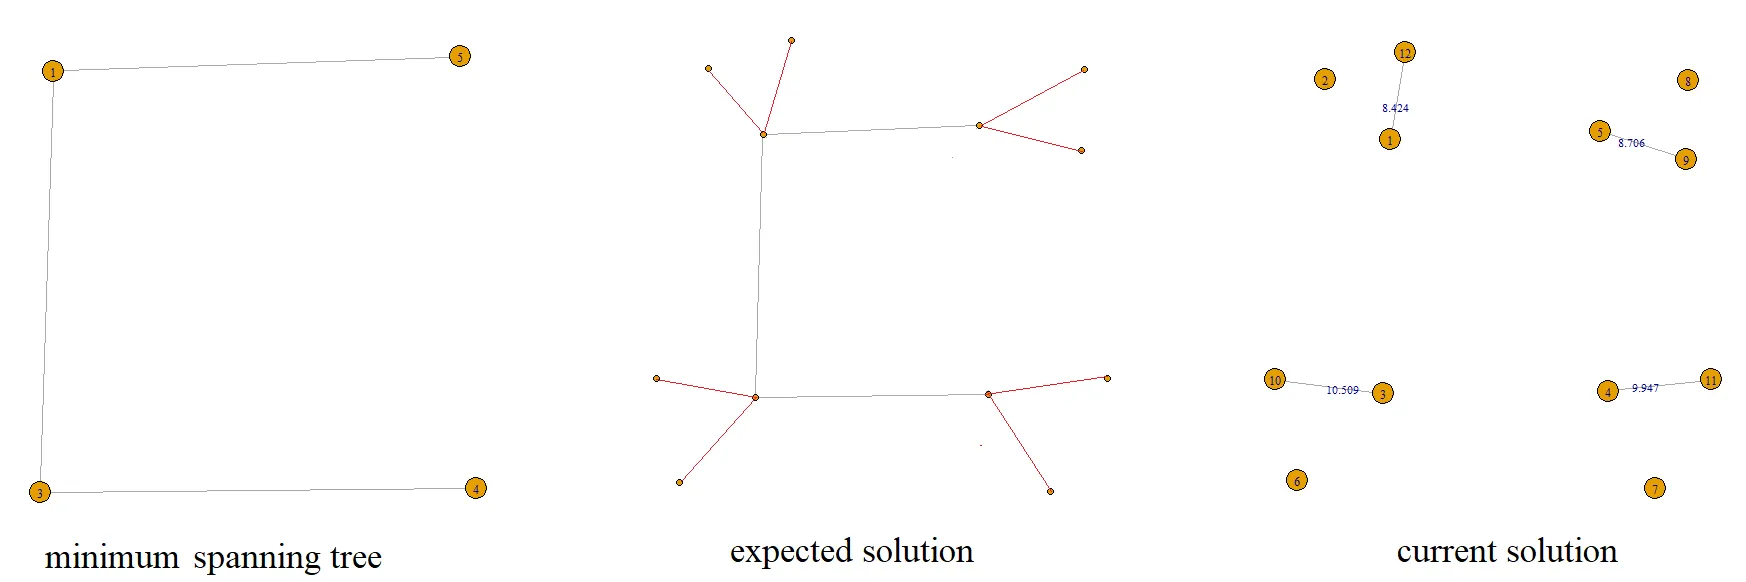
我需要找到分类为1的点的最小生成树,然后将每个分类为0的点连接(添加边)到其最近的category = 1点。
最小生成树是在具有分类为1的点上构建的。
ones    <- tmp[tmp$category == 1,]
n       <- dim(ones)[1]

d       <- matrix(0, n, n)
d       <- as.matrix(dist(cbind(ones$cx, ones$cy)))

g1        <- graph.adjacency(d, weighted=TRUE, mode="undirected")
V(g1)$name <- tmp[tmp$category == 1,]$Name
mylayout = as.matrix(cbind(ones$cx, -ones$cy))

mst <- minimum.spanning.tree(g1) # Find a minimum spanning tree

plot(mst, layout=mylayout,
         vertex.size      = 10,
         vertex.label     = V(g1)$name,
         vertex.label.cex =.75,
         edge.label.cex  = .7,
)
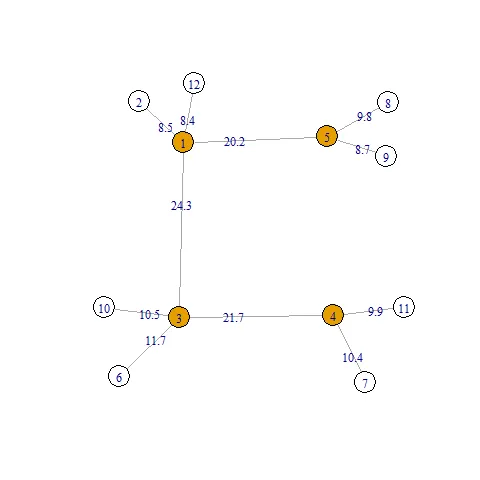
预期结果位于图形中心。
 我目前的尝试是:
n       <- dim(tmp)[1]
d       <- matrix(0, n, n)
d       <- as.matrix(dist(cbind(tmp$cx, tmp$cy)))


d[tmp$category %*% t(tmp$category) == 1] = Inf
d[!sweep(d, 2, apply(d, 2, min), `==`)] <- 0


g2        <- graph.adjacency(d, weighted=TRUE, mode="undirected")
mylayout = as.matrix(cbind(tmp$cx, -tmp$cy))
V(g2)$name <- tmp$Name

plot(g2, layout=mylayout,
         vertex.size      = 10,
         vertex.label     = V(g2)$name,
         vertex.label.cex =.75,
         edge.label       = round(E(g2)$weight, 3),
         edge.label.cex  = .7,
)
可以看出,我已经找到了最小的距离,并且只添加了一条边。
问题:如何定义所有可能点的条件?
mylayout <- as.matrix(cbind(tmp$cx, -tmp$cy)) mylayout <- mylayout[as.integer(c(row.names(pts1), row.names(pts0))), ]来恢复点的原始位置,但我不知道如何重新排序mylayout中的行。 - Nick