igraph; 节点之间的距离

4

我正在使用igraph

g <- graph_from_adjacency_matrix(adj2, mode = "directed") 

plot.igraph(g, vertex.size = 0.01, edge.arrow.size = 0.09, vertex.label.cex = 0.3, vertex.color = "white", vertex.shape = "none")

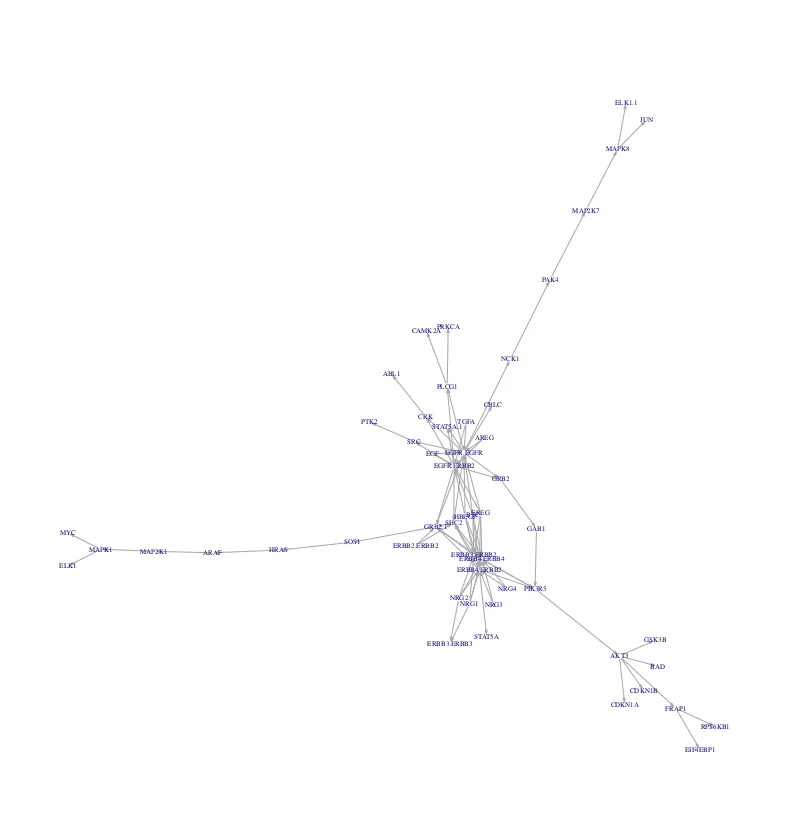
我遇到的问题是一些节点彼此非常靠近,当我打印时很难看清一些节点。
我想要在靠近的节点之间设置更大的距离(例如中央节点群)。
谢谢!

enter image description here

1个回答

4
你可以使用一些布局来提取网络并使其更易读。这可以通过不同的布局来完成,这里是一个fruchterman.reingold算法的例子:
plot.igraph(g, layout =  layout.fruchterman.reingold, vertex.size = 0.01, edge.arrow.size = 0.09, vertex.label.cex = 0.3, vertex.color = "white", vertex.shape = "none")

另一个例子是使用 layout=layout.auto。您需要找到最适合您数据的布局。您可以在 CRAN 文档中阅读有关不同布局的更多信息:igraph

网页内容由stack overflow 提供, 点击上面的
可以查看英文原文,
原文链接