我正在使用officer和rvg包,将R中的图表作为可编辑的向量图形导入MS PowerPoint。以下是可复制的示例。
我正在寻找一种用Python实现类似解决方案的方法,最好使用matplotlib。关键部分并不是从IDE创建幻灯片,而是可编辑的矢量图形部分,即绘图应该以分组对象的形式出现在PowerPoint中,由各种简单的PowerPoint几何元素(如线条、正方形和文本字段)组成。
R示例:
library(tidyverse)
library(officer)
library(rvg)
# Get some data and make a plot
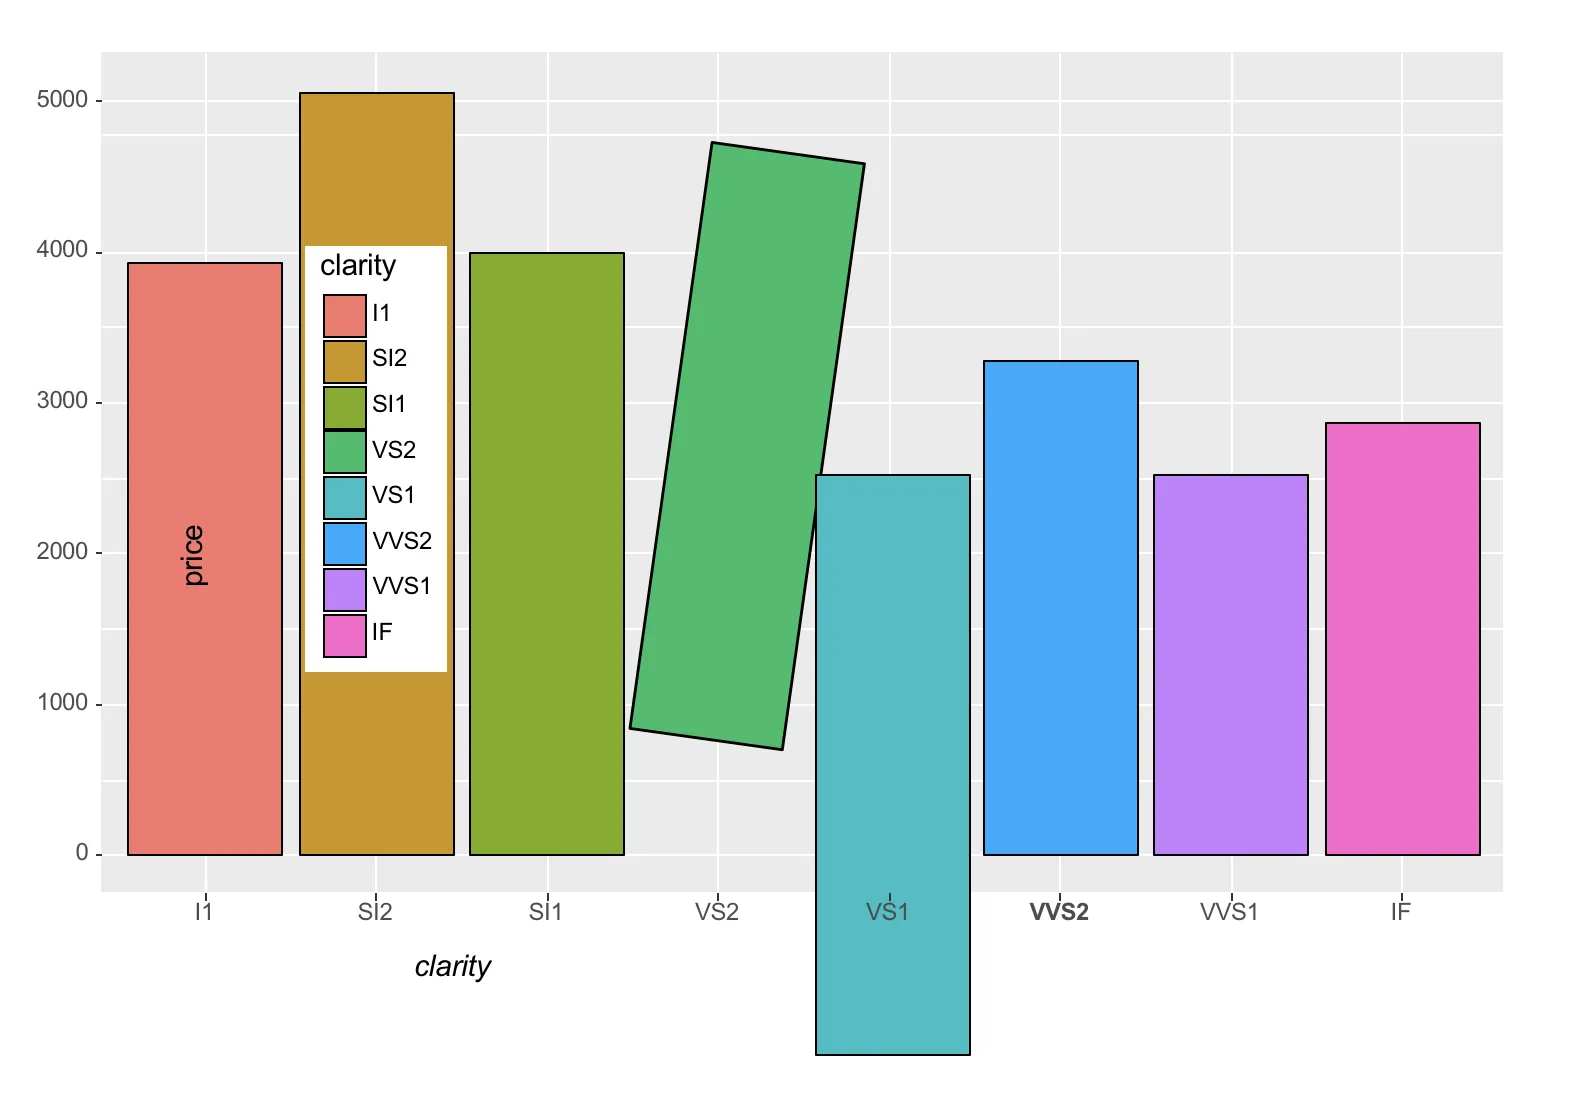
ggp <- diamonds %>%
group_by(clarity) %>%
summarise(price = mean(price)) %>%
ggplot(aes(x = clarity, y = price, fill = clarity)) +
geom_bar(stat = 'identity', colour = 'black')
# Create a new powerpoint document
doc <- read_pptx()
doc <- add_slide(doc, 'Title and Content', 'Office Theme')
# Add the plot
doc <- ph_with_vg(doc, ggobj = ggp, type = 'body')
# Write the document to a file
print(doc, target = 'plots.pptx')
生成的图表是可以完全编辑的: