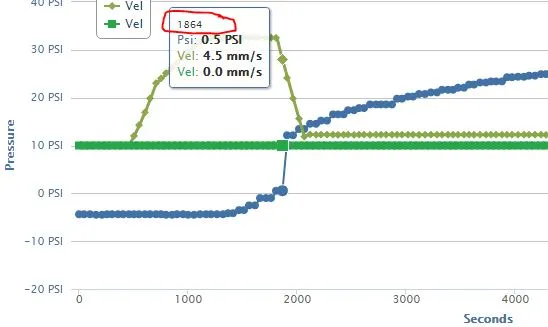
我该如何修改x轴的工具提示值?我想要添加前缀并将值除以1000。在这个例子中,x轴数据是以毫秒为单位的,但我想以秒为单位显示它,并保留两位小数。我可以使用格式化程序函数来更改x轴标签,但不知道如何更改工具提示。
如果只需要添加后缀,可以使用headerFormat来完成:
headerFormat: '<span style="font-size: 10px"> {point.key}s </span><br/>'
但是,如果你想在其中进行除法运算,那么你需要使用格式化函数来完全控制:
    tooltip: {
        formatter: function(d){
            var rV = (this.x / 1000).toFixed(2)  + "s <br/>";
            rV += '<span style="color:' + this.point.color + '">\u25CF</span> ' + this.series.name + ': <b> ' + this.y + '</b><br/>';
            return rV;
        }
    },
这是一个可运行的示例:
$(function () {
    $('#container').highcharts({

        tooltip: {
            formatter: function(d){
                var rV = (this.x / 1000).toFixed(2)  + "s <br/>";
                rV += '<span style="color:' + this.point.color + '">\u25CF</span> ' + this.series.name + ': <b> ' + this.y + '</b><br/>';
                return rV;
   }
        },

        series: [{
            name: 'Short',
            data: [[1.23 * 1000, Math.random() * 10], [2.343 * 1000, Math.random() * 10],[3.343 * 1000, Math.random() * 10],[4.343 * 1000, Math.random() * 10],[5.343 * 1000, Math.random() * 10]]
        }]
    });
});<script src="https://ajax.googleapis.com/ajax/libs/jquery/2.1.1/jquery.min.js"></script>
<script src="https://code.highcharts.com/highcharts.js"></script>
<div id="container" style="height: 300px"></div>编辑
这里是您的代码示例的更新版本。
如果有多个系列,您需要一个共享工具提示并循环点对象:
   tooltip: {
        formatter: function(d){
            var rV = (this.x / 1000).toFixed(2)  + "s <br/>";
            this.points.forEach(function(d){
              rV += '<span style="color:' + d.color + '">\u25CF</span> ' + d.series.name + ': <b> ' + d.y + '</b><br/>';
            });
            return rV;
        },
        shared: true
    },
完整可运行代码:
$(function () {
    $('#container').highcharts({
        chart: {
            zoomType: 'xy'
        },
        title: {
            text: 'Profile'
        },
        subtitle: {
            text: '(pressure & velocity vs. dispense time)'
        },
        xAxis: [{
            //categories: [0,48,98,150,200],
            //labels:{rotation:-45, step:0}
            title: {
                enabled: true,
                text: 'Seconds from start' //Seconds from start of Dispense
            },
            name: 'test',
            labels: {
                formatter: function () {
                    return Highcharts.numberFormat(this.value / 1000, 3);
                }
            },
            crosshair: true
        }],
        yAxis: [{ // Primary yAxis
            labels: {
                formatter: function () {
                    return this.value + ' PSI';
                },
                style: {
                    color: '#4572A7'
                }
            },
            title: {
                text: 'Pressure',
                style: {
                    color: '#4572A7'
                }
            },
            opposite: false

        }, { // Secondary yAxis
            gridLineWidth: 0,
            title: {
                text: 'Vel', //Pallet
                style: {
                    color: '#89A54E'
                }
            },
            labels: {
                formatter: function () {
                    return this.value + ' mm/s';
                },
                style: {
                    color: '#89A54E'
                }
            },
            opposite: true
        }],
        tooltip: {
            shared: true,
            formatter: function(d){
                var rV = (this.x / 1000).toFixed(2)  + "s <br/>";
                this.points.forEach(function(d,i){
                  rV += '<span style="color:' + d.color + '">\u25CF</span> ' + d.series.name + ': <b> ' + d.y;
                  if (i === 0){
                      rV += ' PSI';
                  } else {
                      rV += ' mm/s';
                  }
                  rV += '</b><br/>';
                });
                return rV;
   },
            valueDecimals: 4,
        },
        plotOptions: {
            spline: {
                marker: {
                    radius: 1,
                }
            }
        },
        legend: {
            layout: 'vertical',
            align: 'left',
            x: 100,
            verticalAlign: 'top',
            y: 20,
            floating: true,
            backgroundColor: '#FFFFFF'
        },
        series: [{
            name: 'PSI',
            color: '#4572A7',
            yAxis: 0,
            data: [
                [0, -8.527222],
                [48, -8.19928],
                [98, -8.19928],
                [150, -8.19928],
                [200, -8.19928]
            ],
            tooltip: {
                valueSuffix: ' PSI'
            },
            marker: {
                radius: 2
            }

        }, {
            name: 'Vel',
            color: '#89A54E',
            yAxis: 1,
            data: [
                [0, 5.376344E-02],
                [48, -5.376344E-02],
                [98, -1.075269E-01],
                [150, 0],
                [200, -2.688172E-01]
            ],
            tooltip: {
                valueSuffix: ' mm/s'
            },
            marker: {
                radius: 2
            }
        }, {
            name: 'Vel',
            color: '#29A54E',
            yAxis: 1,
            data: [
                [0, -0],
                [48, 4.032258E-01],
                [98, -0],
                [150, 4.032258E-01],
                [200, -4.032258E-01]
            ],
            tooltip: {
                valueSuffix: ' mm/s'
            },
            marker: {
                radius: 2
            }
        }]
    });
});<script src="https://ajax.googleapis.com/ajax/libs/jquery/2.1.1/jquery.min.js"></script>
<script src="https://code.highcharts.com/highcharts.js"></script>
<div id="container" style="height: 300px"></div>