我有一个带有四个标签的饼图:
var data = [{
    data: [50, 55, 60, 33],
    labels: ["India", "China", "US", "Canada"],
    backgroundColor: [
        "#4b77a9",
        "#5f255f",
        "#d21243",
        "#B27200"
    ],
    borderColor: "#fff"
}];
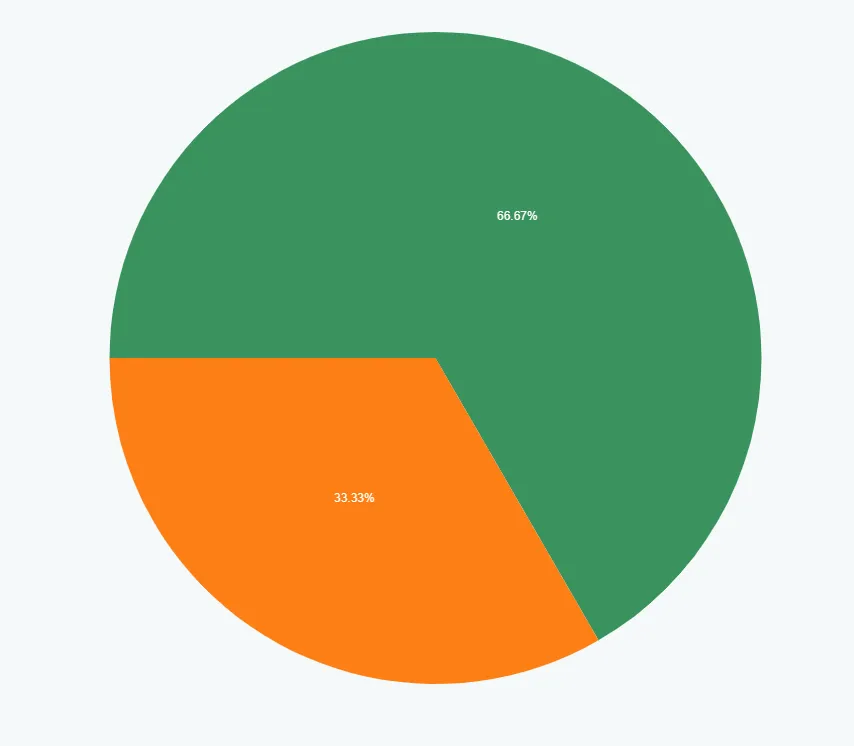
我想使用chartjs-plugin-datalabels插件在每个饼图块中显示百分比值,以下是代码:
formatter: (value, ctx) => {

        let datasets = ctx.chart.data.datasets;

        if (datasets.indexOf(ctx.dataset) === datasets.length - 1) {
            let sum = 0;
            datasets.map(dataset => {
                sum += dataset.data[ctx.dataIndex];
            });
            let percentage = Math.round((value / sum) * 100) + '%';
            return percentage;
        } else {
            return percentage;
        }
    },
    color: '#fff',
}
我得到了所有馅饼块的100%价值,而不是各自的百分比。
这是JSFiddle(https://jsfiddle.net/kingBethal/a1Lvn4eb/7/)。

chartjs-plugin-labels可以实现这个功能,但是我更喜欢chartjs-plugin-datalabels,因为我在其他图表函数中依赖于这个插件。 - theKing